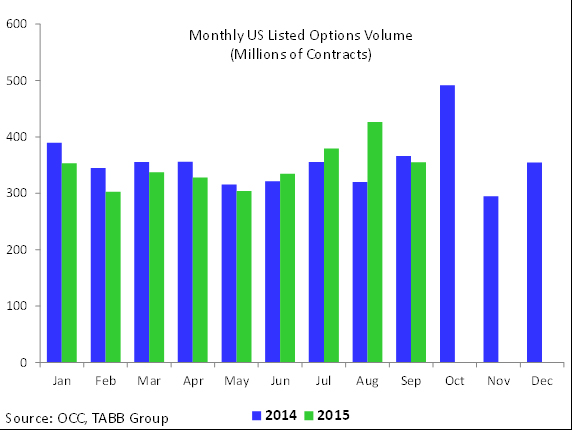
While September US listed options volumes fell 17% from a tumultuous August, September still came in as the third-highest month for volume in 2015, according to the monthly TABB Options LiquidityMatrix™, now managed by Callie Bost, a listed derivatives analyst at TABB Group, covering market structure, regulation, technology and trader psychology in exchange-traded options and futures. She recently joined TABB from Bloomberg, after covering US equities and options on broad-market indices, ETFs and single stocks.

US listed options volumes came in at 354.8 million contracts for September 2015, 3% lower than the year-ago September and 17% lower than August, which garnered the highest monthly options volume in 2015. Still, says Bost, September was the third-highest month for volume in 2015, pointing out that total US listed options volumes year-to-date is down 0.2% from the same period in 2014.
Volume slipped from last month even as turbulence continued in equity markets as the Federal Reserve’s decision to keep interest rates unchanged and economic fatigue in China kept investors on edge.
One beneficiary of the volatility was CBOE, which saw trading in its S&P 500 index options surge to 23.6 million contracts in September, a 36% increase over September 2014 totals.
Increased hedging demand and the liquidity of the instrument drew investor attention and also contributed to a sharp rise in average trade value at CBOE.
The average trade value at CBOE jumped to $20.7 thousand in September, an increase of 110% from the average seen as recently as May 2015, Bost says.
The Options LiquidityMatrix, which includes options trading volumes and statistics on execution metrics for each US listed options exchange as well as the industry as a whole, is available at http://tabbforum.com/liquidity-matrix/options. Charts and data tables in the report include:
- Options volume by exchange on year-to-date and monthly basis.
- Options market share by exchange for AMEX, BATS, BOX, C2, CBOE, ISE, ISE Gemini, MIAX, Nasdaq, Nasdaq BX, NYSE Arca and OMX PHLX.
- Options market quality for penny options classes and all options trades, including
- Average bid/ask spread
- Average bid/offer size
- Number of series traded
- Average trade size (contracts)
- Average trade value
- Percentage executed at bid/ask
- Percentage of time at best bid/offer
- Percentage of time at best bid/offer and greatest size


