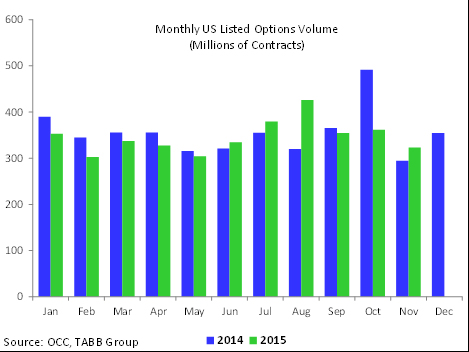
US listed options volumes dropped 11% from last month as quieter markets and the Thanksgiving holiday squelched trading.
According to TABB Group’s just published Options LiquidityMatrix™, options traders capped their third-slowest month of trading of 2015 in November.
“US listed options volumes,” says Callie Bost, the derivatives research analyst who produces the OLM, “totaled 323.3 million contracts last month, 11% lower than October’s volume but 9.7% higher than the year-ago November. Through November, 2015 year-to-date volume is 2.7% below 2014 same-period totals.”

While volumes plunged last month as market swings calmed from a three-month period of turbulence, the S&P 500 rose less than 0.1% in November as the CBOE VIX Index averaged 16.2 during the month. The Thanksgiving holiday, Bost points out, led to further depressed volumes as the options market was closed November 26 and half of November 27.
BATS’ launch of its EDGX options exchange on November 2 was one spark of excitement for the industry during the sleepy month. Volume on EDGX, which employs a customer priority, pro-rata allocation model, says Bost, was about 454,000 contracts, or 0.2% of total volume for the month.
The Options LiquidityMatrixTM is a monthly analysis of options market activity published by TABB Group with analysis and statistics from Hanweck Associates. The report includes options trading volumes and statistics on execution metrics for each US listed options exchange and the industry, using data sourced from the OCC and Premium Hosted Database (PhD),a joint offering from Hanweck Associates and the International Securities Exchange (ISE).
The Options LiquidityMatrix™ includes data and analysis separately for penny options classes and all options trades. Charts and data tables in the report include:
- Options volume by exchange on year-to-date and monthly basis.
- Options market share by exchange for AMEX, BATS, BOX, C2, CBOE, ISE, ISE Gemini, MIAX, Nasdaq, Nasdaq BX, NYSE Arca and OMX PHLX.
- Options market quality for penny options classes and all options trades, including
- Average bid/ask spread
- Average bid/offer size
- Number of series traded
- Average trade size (contracts)
- Average trade value
- Percentage executed at bid/ask
- Percentage of time at best bid/offer
- Percentage of time at best bid/offer and greatest size
For more details on US options market activity, see http://tabbforum.com/liquidity-matrix/options.


