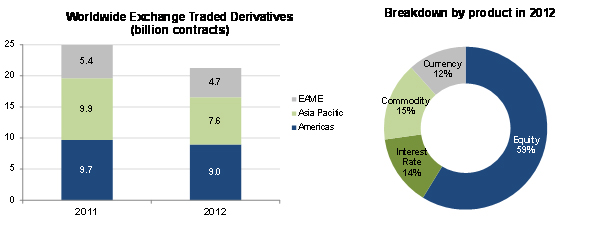
For the first time since 2004, the number of Exchange Traded Derivatives (ETD) worldwide decreased in 2012 by 15% to 21 billion, according to statistics compiled by the World Federation of Exchanges (WFE).
The WFE, which annually conducts a survey on derivative markets, found that in 2012, 21 billion derivative contracts (11 billion futures and 10 billion options) were traded on exchanges worldwide - a decrease from the 25 billion traded in 2011. The full WFE report on derivatives markets will be available following the annual IOMA conference held this year in Busan, South Korea, from 5 to 8 May 2013.

Source: World Federation of Exchanges
Other highlights of the preliminary WFE derivatives report regarding exchange traded derivatives (ETD):
- Equity derivatives: The drop in equity derivatives (-19%) mirrors the decline in the value of cash equities and is probably explained by the significant decrease in volatility observed in 2012. It is also partly explained by the size changing of the KRX (Korea Exchange) KOSPI 200 contracts, the weight of which is very significant. When those contracts are excluded from the statistics, the decrease becomes less pronounced (-7.5%).
- Interest rate derivatives: The volume of Interest Rate options and futures traded also decreased significantly (-15%). Factors generally seen as unfavorable for interest rates derivatives (low interest rates environments, no economic growth and credit expansion) continue to prevail in certain regions and could explain that trend.
- Currency derivatives: The highest decrease in 2012 (-22.5%) was seen by currency derivatives, but was partly due to the comparison with very high volumes registered in recent years. Contracts traded in India still account for a large part of volume (60%) and primarily explains the 2012 decrease as well as the huge increases observed in recent years. In other countries the volumes increased by 3% in 2012.
- Commodity derivatives: The only segment that experienced an increase in 2012 was commodities (+19%), which overcame the interest rate and the currency derivatives markets in terms of number of traded contracts. This increase in volumes was partly, but not only, explained by Mainland Chinese Exchanges that experienced a 34% increase and that accounted for 41% of the global volumes in 2012.
- Other derivatives: the “other derivatives” category comprises a wide range of various and different products such as exotic options and futures, REIT derivatives, Dividend and Dividend Index derivatives or CFDs.
Volume and Growth Rate of Derivative Contracts Traded on Regulated Exchanges (million contracts)
|
2012 |
2011 |
2012/2011 |
|
|
Single Stock Options |
3 995 |
4 063 |
-1.7% |
|
Single Stock Futures |
1 024 |
1 122 |
-8.7% |
|
Stock Index Options |
3 628 |
5 712 |
-36.5% |
|
Stock Index Futures |
2 260 |
2 640 |
-14.4% |
|
ETF Options |
1 382 |
1 713 |
-19.3% |
|
Total Equity |
12 289 |
15 249 |
-19.4% |
|
STIR Options |
380 |
491 |
-22.7% |
|
STIR Futures |
1 224 |
1 427 |
-14.2% |
|
LTIR Options |
171 |
168 |
1.8% |
|
LTIR Futures |
1 159 |
1 381 |
-16.1% |
|
Total Interest Rate |
2 933 |
3 467 |
-15.4% |
|
Currency Options |
287 |
297 |
-3.1% |
|
Currency Futures |
2 142 |
2 839 |
-24.6% |
|
Total Currency |
2 429 |
3 136 |
-22.5% |
|
Commodity Options |
190 |
171 |
11.4% |
|
Commodity Futures |
3 075 |
2 579 |
19.3% |
|
Total Commodity |
3 265 |
2 749 |
18.8% |
|
Other Options |
115 |
101 |
14.0% |
|
Other Futures |
121 |
90 |
34.8% |
|
Other Derivatives |
102 |
170 |
-40.0% |
|
Total Other derivatives |
338 |
361 |
-6.2% |
|
GRAND Total |
21 255 |
24 963 |
-14.9% |
Source: WFE IOMA Survey – Including OTC trades registered on the exchanges


