ETFGI, a leading independent research and consultancy firm covering trends in the global ETF/ETP ecosystem, reported today that equity-based Smart Beta ETFs and ETPs listed globally gathered net inflows of US$7.38 billion during January. Total assets invested in the global Smart Beta ETF and ETP industry increased 10.1%, from US$618 billion at the end of December, to US$680 billion, according to ETFGI’s January 2019 ETF and ETP Smart Beta industry landscape insights report, an annual paid-for research subscription service. (All dollar values in USD unless otherwise noted.)
Highlights
- In January 2019, Smart Beta ETFs/ETPs attracted $7.38 Bn in net new assets.
- During the month, 23 Smart Beta ETFs/ETPs were launched by 19 providers.
- 36th consecutive month of net inflows into Smart Beta ETFs/ETPs.
At the end of January 2019, there were 1,322 Smart Beta classified ETFs/ETPs, with 2,404 listings, assets of $680 Bn, from 164 providers listed on 40 exchanges in 32 countries. Following net inflows of $7.38 Bn and market moves during the month, assets invested in Smart Beta ETFs/ETPs listed globally increased by 10.1%, from $618 Bn at the end of December 2018, to $680 Bn.
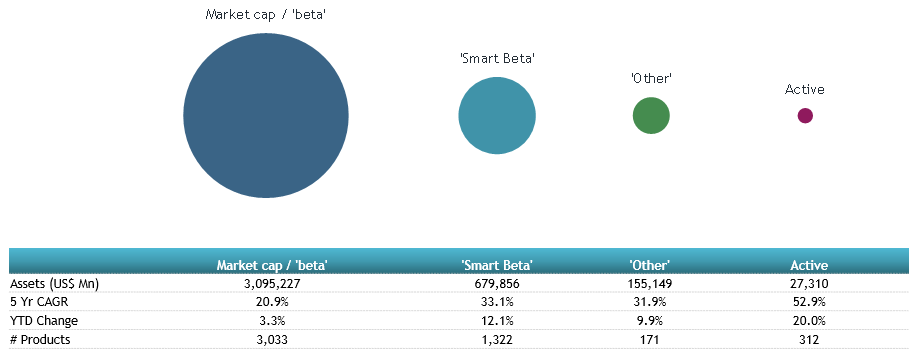
Comparison of assets in market cap, smart beta, other and active equity products

ETFGI, a leading independent research and consultancy firm covering trends in the global ETF/ETP ecosystem, reported today that equity-based Smart Beta ETFs and ETPs listed globally gathered net inflows of US$7.38 billion during January. Total assets invested in the global Smart Beta ETF and ETP industry increased 10.1%, from US$618 billion at the end of December, to US$680 billion, according to ETFGI’s January 2019 ETF and ETP Smart Beta industry landscape insights report, an annual paid-for research subscription service. (All dollar values in USD unless otherwise noted.)
Highlights
- In January 2019, Smart Beta ETFs/ETPs attracted $7.38 Bn in net new assets.
- During the month, 23 Smart Beta ETFs/ETPs were launched by 19 providers.
- 36th consecutive month of net inflows into Smart Beta ETFs/ETPs.
At the end of January 2019, there were 1,322 Smart Beta classified ETFs/ETPs, with 2,404 listings, assets of $680 Bn, from 164 providers listed on 40 exchanges in 32 countries. Following net inflows of $7.38 Bn and market moves during the month, assets invested in Smart Beta ETFs/ETPs listed globally increased by 10.1%, from $618 Bn at the end of December 2018, to $680 Bn.
Comparison of assets in market cap, smart beta, other and active equity products


Multi factor ETFs and ETPs continued to attract the greatest monthly net inflows, seeing $2.36 Bn in January. Dividend-Factor ETFs and ETPs saw the greatest outflows during the month, amounting to $657 Mn.
Substantial inflows can be attributed to the top 20 Smart Beta ETFs/ETPs's by net new assets, which collectively gathered $8.73 Bn in January, the iShares Edge MSCI USA Quality Factor ETF (QUAL US) gathered $1.76 Bn alone.
Top 20 Smart Beta ETFs/ETPs by net new assets January 2019
|
Name |
Ticker |
Assets |
NNA |
NNA |
|
iShares Edge MSCI USA Quality Factor ETF |
QUAL US |
9,139 |
1,756 |
1,756 |
|
iShares MSCI USA Minimum Volatility ETF |
USMV US |
21,172 |
1,041 |
1,041 |
|
Vanguard Value ETF |
VTV US |
44,965 |
603 |
603 |
|
Invesco S&P 500 High Dividend Low Volatility ETF |
SPHD US |
3,241 |
548 |
548 |
|
iShares Edge MSCI EM Minimum Volatility UCITS ETF |
EMMV LN |
1,063 |
420 |
420 |
|
iShares Core Dividend Growth ETF |
DGRO US |
5,790 |
418 |
418 |
|
iShares MSCI International Developed Quality Factor ETF |
IQLT US |
546 |
410 |
410 |
|
Schwab US Large-Cap Value ETF |
SCHV US |
5,442 |
397 |
397 |
|
XACT Nordic High Dividend Low Volatility UCITS ETF |
XACTHDIV SS |
713 |
382 |
382 |
|
iShares Edge MSCI Minimum Volatility EAFE ETF |
EFAV US |
10,356 |
337 |
337 |
|
iShares Edge MSCI Minimum Volatility Emerging Markets ETF |
EEMV US |
5,552 |
301 |
301 |
|
Invesco S&P 500 Low Volatility ETF |
SPLV US |
8,699 |
265 |
265 |
|
Invesco S&P MidCap Low Volatility ETF |
XMLV US |
2,125 |
265 |
265 |
|
Goldman Sachs ActiveBeta U.S. Large Cap Equity ETF |
GSLC US |
4,225 |
262 |
262 |
|
Vanguard Growth ETF |
VUG US |
35,674 |
239 |
239 |
|
SPDR Portfolio S&P 500 Growth ETF |
SPYG US |
3,621 |
236 |
236 |
|
First Trust Capital Strength ETF |
FTCS US |
1,691 |
229 |
229 |
|
Schwab US Dividend Equity ETF |
SCHD US |
8,367 |
227 |
227 |
|
SPDR Portfolio S&P 500 Value ETF |
SPYV US |
2,652 |
221 |
221 |
|
Hartford Multifactor Developed Markets (Ex-US) ETF |
RODM US |
1,643 |
170 |
170 |

Multi factor ETFs and ETPs continued to attract the greatest monthly net inflows, seeing $2.36 Bn in January. Dividend-Factor ETFs and ETPs saw the greatest outflows during the month, amounting to $657 Mn.
Substantial inflows can be attributed to the top 20 Smart Beta ETFs/ETPs's by net new assets, which collectively gathered $8.73 Bn in January, the iShares Edge MSCI USA Quality Factor ETF (QUAL US) gathered $1.76 Bn alone.
Top 20 Smart Beta ETFs/ETPs by net new assets January 2019
|
Name |
Ticker |
Assets |
NNA |
NNA |
|
iShares Edge MSCI USA Quality Factor ETF |
QUAL US |
9,139 |
1,756 |
1,756 |
|
iShares MSCI USA Minimum Volatility ETF |
USMV US |
21,172 |
1,041 |
1,041 |
|
Vanguard Value ETF |
VTV US |
44,965 |
603 |
603 |
|
Invesco S&P 500 High Dividend Low Volatility ETF |
SPHD US |
3,241 |
548 |
548 |
|
iShares Edge MSCI EM Minimum Volatility UCITS ETF |
EMMV LN |
1,063 |
420 |
420 |
|
iShares Core Dividend Growth ETF |
DGRO US |
5,790 |
418 |
418 |
|
iShares MSCI International Developed Quality Factor ETF |
IQLT US |
546 |
410 |
410 |
|
Schwab US Large-Cap Value ETF |
SCHV US |
5,442 |
397 |
397 |
|
XACT Nordic High Dividend Low Volatility UCITS ETF |
XACTHDIV SS |
713 |
382 |
382 |
|
iShares Edge MSCI Minimum Volatility EAFE ETF |
EFAV US |
10,356 |
337 |
337 |
|
iShares Edge MSCI Minimum Volatility Emerging Markets ETF |
EEMV US |
5,552 |
301 |
301 |
|
Invesco S&P 500 Low Volatility ETF |
SPLV US |
8,699 |
265 |
265 |
|
Invesco S&P MidCap Low Volatility ETF |
XMLV US |
2,125 |
265 |
265 |
|
Goldman Sachs ActiveBeta U.S. Large Cap Equity ETF |
GSLC US |
4,225 |
262 |
262 |
|
Vanguard Growth ETF |
VUG US |
35,674 |
239 |
239 |
|
SPDR Portfolio S&P 500 Growth ETF |
SPYG US |
3,621 |
236 |
236 |
|
First Trust Capital Strength ETF |
FTCS US |
1,691 |
229 |
229 |
|
Schwab US Dividend Equity ETF |
SCHD US |
8,367 |
227 |
227 |
|
SPDR Portfolio S&P 500 Value ETF |
SPYV US |
2,652 |
221 |
221 |
|
Hartford Multifactor Developed Markets (Ex-US) ETF |
RODM US |
1,643 |
170 |
170 |
Please