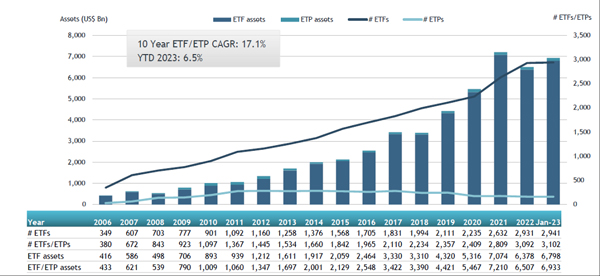
ETFGI, a leading independent research and consultancy firm covering trends in the global ETFs ecosystem, reported today that ETFs industry in the United States gathered net inflows of US$39.51 billion during January. During the month, assets invested in ETFs industry in the United States increased by 6.5%, from US$6.51 trillion at the end of December to US$6.93 trillion in January 2023, according to ETFGI's January 2023 US ETFs and ETPs industry landscape insights report, the monthly report which is part of an annual paid-for research subscription service. (All dollar values in USD unless otherwise noted.)
Highlights
- ETFs industry in the United States gathered net inflows of $39.51 Bn in January.
- 9th month of consecutive net inflows.
- Assets of $6.93 Tn ETFs industry in the United States at the end of January.
- During January assets increased 6.5%, going from $6.51 Tn at end of 2022 to $6.93 Tn.
“The S&P 500 increased by 6.28 % in January. Developed markets excluding the US increased by 8.27% in January. Italy (up 14.52%) and the Netherlands (up 14.47%) saw the largest increases amongst the developed markets in January. Emerging markets increased by 6.66% during January. Mexico (up 16.53%) and Czech Republic (up 16.46%) saw the largest increases amongst emerging markets in January.” According to Deborah Fuhr, managing partner, founder and owner of ETFGI.
Growth in US ETF and ETP assets as of the end of January 2023

The ETFs industry in the United States had 3,102 products, assets of $6.93 trillion, from 275 providers listed on 3 exchanges at the end of January.
During January, ETFs industry in the United States gathered net inflows of $39.51 Bn. Equity ETFs gathered net inflows of $10.85 Bn during January, lower than the $14.10 Bn in net inflows gathered in January 2022. Fixed income ETFs gathered net inflows of $18.50 Bn during January, higher than the $9.31 Bn in net outflows fixed income products suffered in January 2022. Commodities ETFs/ETPs reported net inflows of $799 Mn during January, lower than the $2.99 Bn in net inflows reported in January 2022. Active ETFs attracted net inflows of $8.59 Bn during the month, higher than the $6.86 Bn in net inflows active products reported in January 2022.
Substantial inflows can be attributed to the top 20 ETFs by net new assets, which collectively gathered $39.38 Bn during January. iShares Core MSCI Emerging Markets ETF (IEMG US) gathered $3.63 Bn, the largest individual net inflow.
Top 20 ETFs by net new assets January 2023: US
|
Name |
Ticker |
Assets |
NNA |
NNA |
|
iShares Core MSCI Emerging Markets ETF |
IEMG US |
72,233.68 |
3,625.93 |
3,625.93 |
|
JPMorgan BetaBuilders Europe ETF |
BBEU US |
7,061.22 |
3,609.91 |
3,609.91 |
|
Vanguard Value ETF |
VTV US |
104,790.04 |
2,654.76 |
2,654.76 |
|
Schwab Short-Term US Treasury ETF |
SCHO US |
12,906.21 |
2,574.24 |
2,574.24 |
|
iShares iBoxx $ Investment Grade Corporate Bond ETF |
LQD US |
39,596.83 |
2,493.12 |
2,493.12 |
|
iShares J.P. Morgan USD Emerging Markets Bond ETF |
EMB US |
17,512.89 |
2,447.20 |
2,447.20 |
|
JPMorgan Equity Premium Income ETF |
JEPI US |
20,240.52 |
2,442.61 |
2,442.61 |
|
SPDR S&P 500 ETF Trust |
SPY US |
379,160.88 |
2,283.30 |
2,283.30 |
|
iShares 20+ Year Treasury Bond ETF |
TLT US |
31,054.62 |
1,991.98 |
1,991.98 |
|
ProShares UltraPro Short QQQ |
SQQQ US |
4,865.57 |
1,900.77 |
1,900.77 |
|
Schwab US Dividend Equity ETF |
SCHD US |
47,189.85 |
1,532.43 |
1,532.43 |
|
iShares iBoxx $ High Yield Corporate Bond ETF |
HYG US |
18,009.11 |
1,448.19 |
1,448.19 |
|
Vanguard Total Stock Market ETF |
VTI US |
278,513.86 |
1,423.34 |
1,423.34 |
|
Vanguard Total International Bond ETF |
BNDX US |
46,999.85 |
1,419.69 |
1,419.69 |
|
iShares MSCI Emerging Markets ETF |
EEM US |
25,688.65 |
1,407.16 |
1,407.16 |
|
iShares Core U.S. Aggregate Bond ETF |
AGG US |
86,604.55 |
1,313.02 |
1,313.02 |
|
iShares MBS ETF |
MBB US |
25,461.87 |
1,258.56 |
1,258.56 |
|
Invesco S&P 500 Equal Weight ETF |
RSP US |
36,368.70 |
1,242.78 |
1,242.78 |
|
Direxion Daily Semiconductors Bear 3x Shares |
SOXS US |
1,661.30 |
1,170.14 |
1,170.14 |
|
iShares 7-10 Year Treasury Bond ETF |
IEF US |
24,783.60 |
1,143.04 |
1,143.04 |
The top 10 ETPs by net assets collectively gathered $2.48 Bn during January. ProShares Ultra DJ-UBS Natural Gas (BOIL US) gathered $772.80 Mn, the largest individual net inflow.
Top 10 ETPs by net new assets January 2023: US
|
Name |
Ticker |
Assets |
NNA |
NNA Jan-23 |
|
ProShares Ultra DJ-UBS Natural Gas |
BOIL US |
832.91 |
772.80 |
772.80 |
|
United States Natural Gas Fund LP |
UNG US |
756.64 |
553.21 |
553.21 |
|
SPDR Gold MiniShares Trust |
GLDM US |
5,860.41 |
385.76 |
385.76 |
|
iShares Silver Trust |
SLV US |
10,975.97 |
238.27 |
238.27 |
|
iShares Gold Trust |
IAU US |
27,937.82 |
183.27 |
183.27 |
|
ProShares Ultra VIX Short-Term Futures |
UVXY US |
594.58 |
153.17 |
153.17 |
|
Invesco CurrencyShares Japanese Yen Trust |
FXY US |
258.12 |
67.61 |
67.61 |
|
MicroSectors FANG+ Index 3X Leveraged ETNs due January 8, 2038 |
FNGU US |
903.68 |
49.90 |
49.90 |
|
iPath Series B S&P 500 VIX Short-Term Futures ETN |
VXX US |
325.73 |
41.63 |
41.63 |
|
ProShares VIX Short-Term Futures ETF |
VIXY US |
242.89 |
29.43 |
29.43 |
Investors have tended to invest in Equity ETFs and ETPs during January.


