


ETFGI, a leading independent research and consultancy firm covering trends in the global ETF/ETP ecosystem, reported today that ETFs and ETPs listed in Europe gathered net inflows of US$3.95 billion in April, bringing year-to-date net inflows to US$35.54 billion. Assets invested in the European ETF/ETP industry finished the month up 2.60%, from US$859.51 billion at the end of March to US$882.20 billion, according to ETFGI's April 2019 European ETF and ETP industry landscape insights report, an annual paid-for research subscription service. (All dollar values in USD unless otherwise noted.)
Highlights
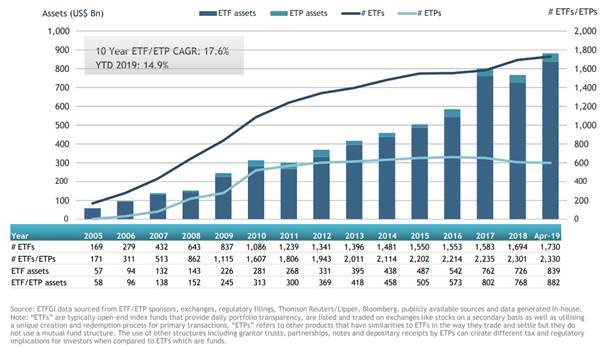
- Assets invested in the European ETF/ETP industry reach $882.20 Bn in April 2019, the highest on record.
- 55th consecutive month of net inflows into ETFs/ETPs listed in Europe.
- April 11th marked the 19th Anniversary of the listing of the first ETFs in Europe.
- Assets invested in the European ETF/ETP industry have risen 14.9% year-to-date.
“Markets appear to have returned to the relative calm they had grown accustomed to over the past few years. Returns for developed indices were higher in April compared to March. The S&P 500 finished April up 4.05%, with year-to-date returns of 13.7%, marking its best quarter since ‘09. The S&P Europe 350 fell -1.42% in March, as economic data from the region continues to send mixed signals, bringing year-to-date returns to 11.85%. The Topix 150 in Japan was up 1.14% in April, bringing year-to-date returns of 3.77%. Emerging & Frontier returns continued to outpace developed markets. The S&P Emerging BMI and Frontier BMI finished March up 1.11% and -0.87%%, bringing year to date returns to 6.12% and 9.87%, respectively.” according to Deborah Fuhr, managing partner and founder of ETFGI.
At the end of April 2019, the European ETF/ETP industry had 2,330 ETFs/ETPs, from 69 providers listed on 29 exchanges. Following net inflows of $3.95 Bn and market moves during the month, assets invested in the European ETF/ETP industry increased by 2.60% from $859.51 Bn at the end of March, to $882.20 Bn.
Growth in European ETF and ETP assets as of the end of April 2019
Equity ETFs/ETPs listed in Europe saw net outflows of $726.00 Mn in April, bringing net inflows for 2019 to $9.45 Bn, substantially less than the $21.27 Bn in net inflows equity products had attracted by the end of April 2018. Fixed income ETFs/ETPs listed in Europe attracted net inflows of $4.42 Bn in April, bringing net inflows for 2019 to $24.24 Bn, considerably greater than the $4.94 Bn in net inflows fixed income products had attracted by the end of April 2018.
Substantial inflows can be attributed to the top 20 ETF's by net new assets, which collectively gathered $8.21 Bn in April, the iShares € High Yield Corp Bond UCITS ETF gathered $836.85 Mn alone.
Top 20 ETFs by net new assets April 2019: Europe
|
Name |
Ticker |
Assets |
NNA |
NNA |
|
iShares € High Yield Corp Bond UCITS ETF |
IHYG LN |
7,586.52 |
1,911.14 |
836.85 |
|
iShares J.P. Morgan EM Local Govt Bond UCITS ETF |
SEML LN |
9,766.41 |
3,062.44 |
777.95 |
|
AMUNDI ETF S&P 500 UCITS ETF USD D |
500USD SW |
2,137.25 |
616.14 |
625.96 |
|
AMUNDI ETF S&P 500 UCITS ETF EUR C |
500 FP |
2,797.69 |
618.32 |
513.14 |
|
Xtrackers MSCI Europe Index UCITS ETF (DR) - 1D |
XIEE GY |
1,218.67 |
482.06 |
447.39 |
|
iShares Core MSCI World UCITS ETF |
IWDA LN |
17,577.09 |
1,351.43 |
430.71 |
|
iShares Edge MSCI USA Quality Factor UCITS ETF |
IUQA LN |
1,058.91 |
909.93 |
430.20 |
|
Amundi Index MSCI Emerging Markets UCITS ETF DR |
AEME FP |
2,045.68 |
871.44 |
418.29 |
|
iShares MSCI Europe UCITS ETF EUR (Dist) |
IMEU LN |
5,724.31 |
388.87 |
396.05 |
|
Xtrackers MSCI Emerging Markets Index UCITS ETF |
XMME GY |
1,982.98 |
618.61 |
383.31 |
|
Invesco MSCI Saudi Arabia UCITS ETF |
MSAU LN |
718.96 |
521.51 |
351.16 |
|
Xtrackers S&P 500 Swap UCITS ETF |
D5BM GY |
5,575.98 |
725.52 |
333.16 |
|
Invesco S&P 500 ETF |
SPXS LN |
5,267.65 |
847.22 |
314.66 |
|
iShares MSCI EMU UCITS ETF |
CSEMU SW |
2,083.71 |
129.30 |
306.29 |
|
iShares Core MSCI EM IMI UCITS ETF |
EMIM LN |
13,301.45 |
1,578.59 |
305.69 |
|
iShares Core € Corp Bond UCITS ETF |
IEBC LN |
10,899.83 |
2,326.37 |
300.73 |
|
iShares NASDAQ 100 UCITS ETF |
CSNDX SW |
3,305.64 |
663.02 |
290.20 |
|
PIMCO US Dollar Short Maturity ETF |
MINT LN |
3,404.44 |
979.71 |
256.89 |
|
Deka DAX UCITS ETF |
ETFDAX GY |
2,339.54 |
144.42 |
246.26 |
|
iShares $ Treasury Bond 1-3yr UCITS ETF |
IBTA LN |
1,701.25 |
668.45 |
240.90 |
|
|

The top 10 ETP's by net new assets collectively gathered $732.17 Mn in April, the Invesco Gold ETC gathered $336.57 Mn alone.
Top 10 ETPs by net new assets April 2019: Europe
|
Name |
Ticker |
Assets |
NNA |
NNA |
|
Invesco Gold ETC |
SGLD LN |
5,455.74 |
522.93 |
336.57 |
|
Xtrackers Energy Booster Euro Hedged ETC |
XCTH GY |
136.16 |
133.46 |
132.20 |
|
ETFS Copper |
COPA LN |
246.13 |
60.04 |
72.31 |
|
ETFS Industrial Metals DJ-UBSCISM |
AIGI LN |
384.30 |
187.32 |
42.37 |
|
ETFS Nickel |
NICK LN |
533.45 |
57.80 |
41.42 |
|
Xtrackers Physical Gold ETC (EUR) |
XAD5 GY |
2,452.49 |
(83.10) |
26.74 |
|
ETFS Physical Platinum |
PHPT LN |
309.32 |
62.63 |
22.41 |
|
ETFS EUR Daily Hedged Industrial Metals |
EIMT IM |
24.30 |
18.81 |
21.34 |
|
Xetra Gold EUR |
4GLD GY |
7,962.75 |
472.08 |
19.28 |
|
ETFS Coffee |
COFF LN |
111.62 |
47.65 |
17.53 |

Investors have tended to invest in fixed income ETFs in April.

