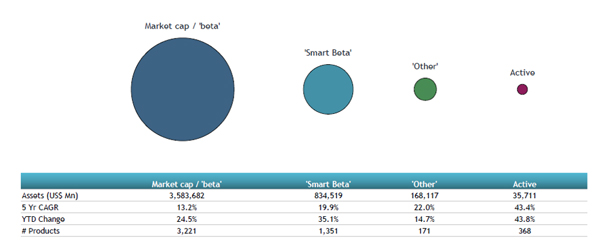
ETFGI, a leading independent research and consultancy firm covering trends in the global ETFs/ETPs ecosystem, reported today that equity-based Smart Beta ETFs and ETPs listed globally gathered net inflows of US$9.72 billion during November. Year-to-date through to the end of November 2019, Smart Beta Equity ETF/ETP assets have increased by 35.1% from US$618 billion to US$835 billion, with a 5-year CAGR of 19.9%, according to ETFGI’s November 2019 ETFs and ETPs Smart Beta industry landscape insights report, an annual paid-for research subscription service. (All dollar values in USD unless otherwise noted.)
Highlights
- Assets invested in Smart Beta Equity ETFs/ETPs reached a record of $835 billion.
- In November, Equity Smart Beta ETFs/ETPs attracted $9.72 billion in net inflows.
- 46thconsecutive month of net inflows into Smart Beta Equity ETFs/ETPs.
At the end of November 2019, there were 1,351 smart beta equity ETFs/ETPs, with 2,530 listings, assets of $835 billion, from 167 providers on 41 exchanges in 33 countries. Following net inflows of $9.72 billion and market moves during the month, assets invested in Smart Beta ETFs/ETPs listed globally increased by 4%, from $803 billion at the end of October 2019 to $835 billion.
Comparison of assets in market cap, smart beta, other and active equity products

ValueETFs and ETPs attracted the greatest monthly net inflows, gathering $4 billion in November. Min/low volatility ETFs and ETPs suffered the greatest outflows during the month and amounted to $895 million.
Substantial inflows can be attributed to the top 20 Smart Beta ETFs/ETPs by net new assets, which collectively gathered $8.33 billion in November, the iShares Edge MSCI USA Quality Factor ETF
(QUAL US) gathered $1.2 billion alone.
Top 20 Smart Beta ETFs/ETPs by net new assets November 2019
|
Name |
Ticker |
Assets |
NNA |
NNA |
|
iShares Edge MSCI USA Quality Factor ETF |
QUAL US |
15,284.55 |
5,954.87 |
1,196.64 |
|
iShares MSCI USA Size Factor ETF |
SIZE US |
1,454.55 |
1,133.31 |
1,022.54 |
|
Vanguard Value ETF |
VTV US |
54,503.44 |
4,383.09 |
867.18 |
|
Vanguard Dividend Appreciation ETF |
VIG US |
40,870.49 |
4,155.20 |
532.68 |
|
iShares Edge MSCI Europe Value Factor UCITS ETF |
IEFV LN |
1,173.44 |
173.63 |
482.71 |
|
iShares Core Dividend Growth ETF |
DGRO US |
9,780.07 |
3,198.17 |
439.30 |
|
First Trust Value Line Dividend Index Fund |
FVD US |
9,080.36 |
3,533.21 |
388.61 |
|
iShares Edge MSCI USA Value Factor ETF |
VLUE US |
4,390.49 |
310.66 |
384.48 |
|
SPDR Portfolio S&P 500 Value ETF |
SPYV US |
4,609.84 |
1,703.74 |
377.88 |
|
iShares Edge MSCI USA Value Factor UCITS ETF |
IUVL LN |
1,343.75 |
559.55 |
369.00 |
|
iShares Edge MSCI World Value Factor UCITS ETF |
IWVL LN |
2,276.36 |
385.46 |
341.76 |
|
VanEck Vectors Morningstar Wide Moat Research ETF |
MOAT US |
3,058.59 |
980.49 |
306.91 |
|
iShares Edge MSCI Minimum Volatility EAFE ETF |
EFAV US |
12,841.43 |
1,939.70 |
270.27 |
|
Schwab US Dividend Equity ETF |
SCHD US |
11,208.24 |
1,777.28 |
229.52 |
|
SPDR S&P Dividend ETF |
SDY US |
19,664.04 |
269.93 |
217.09 |
|
iShares MSCI EAFE Value ETF |
EFV US |
5,644.72 |
(583.43) |
215.67 |
|
ProShares S&P 500 Aristocrats ETF |
NOBL US |
6,227.87 |
1,599.92 |
214.71 |
|
iShares S&P 500 Value ETF |
IVE US |
17,295.58 |
(1,146.89) |
188.12 |
|
C-Tracks Exchange-Traded Notes Miller/Howard Strategic Dividend Reinvestor |
DIVC US |
143.18 |
144.54 |
144.54 |
|
Samsung KODEX Top5Plus Total Return ETF - Equity |
315930 KS |
1,059.11 |
614.01 |
141.50 |


.jpg)


