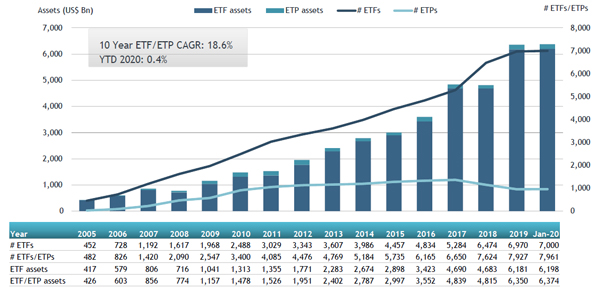
ETFGI, a leading independent research and consultancy firm covering trends in the global ETFs and ETPs ecosystem, reported today that ETFs and ETPs listed globally gathered net inflows of US$67.15 billion at the end of January 2020, which is significantly higher than the US$17.23 billion gathered at this point last year. Assets invested in the global ETFs/ETPs industry increased by 0.4%, from US$6.35 trillion at the end of December 2019, to US$6.37 trillion at the end of January, according to ETFGI's January 2020 Global ETFs and ETPs industry landscape insights report, an annual paid-for research subscription service. (All dollar values in USD unless otherwise noted.)
Highlights
- Assets in Global ETFs and ETPs industry reached a new milestone of $6.37 trillion at the end of January.
- The $67.15 Bn in net inflows gathered in January is the 8th highest monthly inflow on record and significantly larger than the $17.23 Bn gathered in January 2019.
- Year-to-date net inflows of $67.15 Bn are the 2nd highest behind only January 2018 with $105.59 Bn.
- Equity products have gathered more net inflows than fixed income products as of the end of January.
"During January the S&P 500 lost 0.04% as markets were affected by the Coronavirus (nCoV) outbreak and offset any optimism on the trade talks with China. Global equities as measured by the S&P Global BMI were also down 1.33% and the S&P Emerging BMI declined 4.3% as well.” According to Deborah Fuhr, managing partner, founder and owner of ETFGI.
Global ETF and ETP assets as of the end of January 2020
The Global ETFs/ETPs industry had 7,961 ETFs/ETPs, with 15,944 listings from 440 providers on 70 exchanges in 58 countries at the end of January.
During January 2020, ETFs/ETPs listed globally gathered net inflows of $67.15 Bn. Equity ETFs/ETPs listed globally gathered net inflows of $34.39 Bn during January, substantially greater than the $8.94 Bn in net outflows equity products attracted during January 2019. Fixed income ETFs/ETPs listed globally attracted net inflows of $21.13 Bn during January, slightly lower than the $23.67 Bn in net inflows fixed income products attracted during January 2019. Commodity ETFs/ETPs reported $4.14 Bn in net inflows during January, which is greater than the $2.77 Bn in net inflows gathered through January 2019.
Substantial inflows can be attributed to the top 20 ETFs by net new assets, which collectively gathered $32.85 Bn at the end of January, the iShares Core MSCI EAFE ETF (IEFA US) gathered $2.59 Bn alone.
Top 20 ETFs by net new inflows January 2020: Global
|
Name |
|
Ticker |
Assets |
NNA |
NNA |
|
iShares Core MSCI EAFE ETF |
|
IEFA US |
74,956.79 |
2,585.78 |
2,585.78 |
|
Vanguard Total Stock Market ETF |
|
VTI US |
139,508.97 |
2,506.04 |
2,506.04 |
|
Vanguard Total Bond Market ETF |
|
BND US |
51,596.18 |
2,277.09 |
2,277.09 |
|
iShares Core S&P 500 ETF |
|
IVV US |
200,971.86 |
2,214.24 |
2,214.24 |
|
iShares Core U.S. Aggregate Bond ETF |
|
AGG US |
72,788.91 |
2,163.27 |
2,163.27 |
|
iShares MBS ETF |
|
MBB US |
23,300.50 |
2,027.77 |
2,027.77 |
|
iShares Trust iShares ESG MSCI USA ETF |
|
ESGU US |
3,391.61 |
1,956.27 |
1,956.27 |
|
Vanguard S&P 500 ETF |
|
VOO US |
132,425.32 |
1,930.25 |
1,930.25 |
|
Vanguard Intermediate-Term Corporate Bond ETF |
|
VCIT US |
28,165.35 |
1,887.02 |
1,887.02 |
|
Vanguard Small-Cap ETF |
|
VB US |
28,598.30 |
1,772.45 |
1,772.45 |
|
Vanguard FTSE Developed Markets ETF |
|
VEA US |
77,936.00 |
1,680.51 |
1,680.51 |
|
iShares MSCI EM ESG Optimized ETF |
|
ESGE US |
1,983.60 |
1,227.37 |
1,227.37 |
|
E FundSI SOE The Belt and Road ETF |
|
515110 CH |
1,153.13 |
1,220.24 |
1,220.24 |
|
Industrial Select Sector SPDR Fund |
|
XLI US |
11,601.43 |
1,195.60 |
1,195.60 |
|
Vanguard Growth ETF |
|
VUG US |
49,019.07 |
1,124.24 |
1,124.24 |
|
Vanguard Total International Bond ETF |
|
BNDX US |
25,827.16 |
1,104.56 |
1,104.56 |
|
iShares 0-5 Year High Yield Corporate Bond ETF |
|
SHYG US |
4,627.37 |
1,066.00 |
1,066.00 |
|
Bharat Bond ETF - April 2023 |
|
BETF423 IN |
989.99 |
996.81 |
996.81 |
|
Consumer Discretionary Select Sector SPDR Fund |
|
XLY US |
15,277.10 |
966.95 |
966.95 |
|
TOPIX Exchange Traded Fund |
|
1306 JP |
100,054.05 |
950.51 |
950.51 |

The top 10 ETPs by net new assets collectively gathered $3.53 Bn in January. The iShares Physical Gold ETC (SGLN LN) gathered $863.09 Mn alone.
Top 10 ETPs by net new inflows January 2019: Global
|
Name |
Ticker |
Assets |
NNA |
NNA |
|
iShares Physical Gold ETC |
SGLN LN |
8,199.86 |
863.09 |
863.09 |
|
iShares Gold Trust |
IAU US |
18,937.78 |
597.49 |
597.49 |
|
SPDR Gold Shares |
GLD US |
45,988.67 |
509.57 |
509.57 |
|
VelocityShares 3x Long Crude Oil ETN |
UWT US |
432.26 |
338.97 |
338.97 |
|
United States Oil Fund LP |
USO US |
1,290.47 |
313.67 |
313.67 |
|
Invesco Gold ETC |
SGLD LN |
7,671.87 |
245.92 |
245.92 |
|
GBS Bullion Securities |
GBS LN |
4,251.08 |
199.87 |
199.87 |
|
United States Natural Gas Fund LP |
UNG US |
530.76 |
166.75 |
166.75 |
|
iPath Series B S&P 500 VIX Short-Term Futures ETN |
VXX US |
1,104.84 |
158.83 |
158.83 |
|
Xetra Gold EUR |
4GLD GY |
10,523.81 |
139.84 |
139.84 |

Investors have tended to invest in core Equity and core Fixed Income ETFs during January.


