


BISX is pleased to announce its BISX All-Share Index and trading statistics for the nine-month period ending September 29, 2017 with comparison to the same period of 2016.
BISX ALL SHARE INDEX
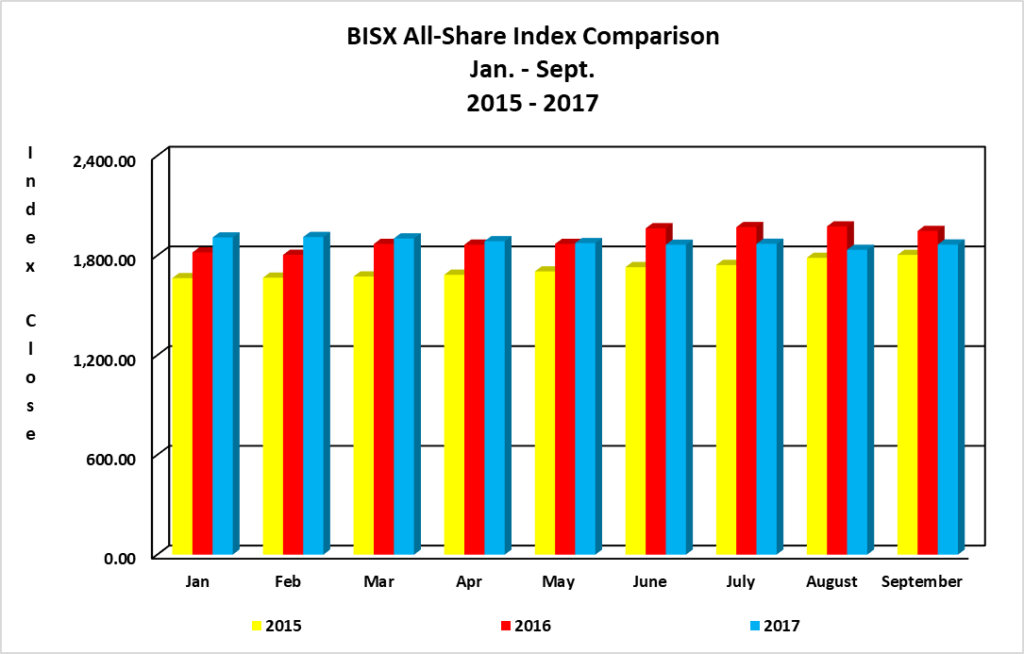
For the nine-month period ending September 29, 2017 the BISX All-Share Index closed at 1,865.88 this represented a year to date decrease of 72.33 or 3.73%. By comparison for the nine-month period ending September 30, 2016 the BISX All-Share Index closed at 1,947.88, this represented a year to date increase of 123.93 or 6.79%. The BISX All-Share Index is a market capitalization weighted index comprised of all primary market listings excluding debt securities.
As at September 29, 2017 the market was comprised of 20 ordinary shares with a market capitalization of $3.944 Billion. In addition, there were 13 preference shares with a market capitalization of $327.25 Million and 19 bonds with a face value of $579 Million.
COMPARISON OF BISX ALL SHARE INDEX TO INTERNATIONAL INDICES
Over the 9-month period January 1 to September 29, 2017, some international equity markets have experienced increases as indicated by the chart below:
| Closing Date | MSCI Emerging Market Index[1] | S&P 500 Index[2] | FTSE 100 Index[3] | BISX All Share Index |
| Dec 30, 2016 |
862.27 |
2,238.83 | 7,142.83 |
1,938.21 |
| Sep 29, 2017 |
1,081.72 |
2,519.36 | 7,372.76 |
1,865.88 |
| % Chg (+/-) |
25.45% |
12.53% | 3.22% |
-3.73% |
TRADING VOLUMES AND VALUES
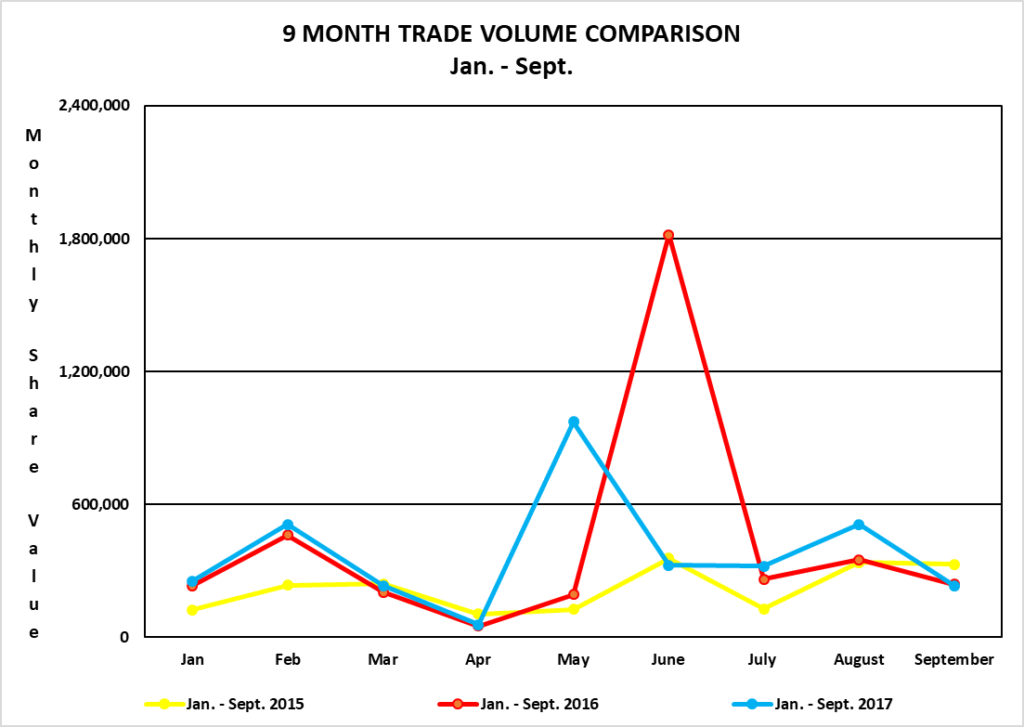
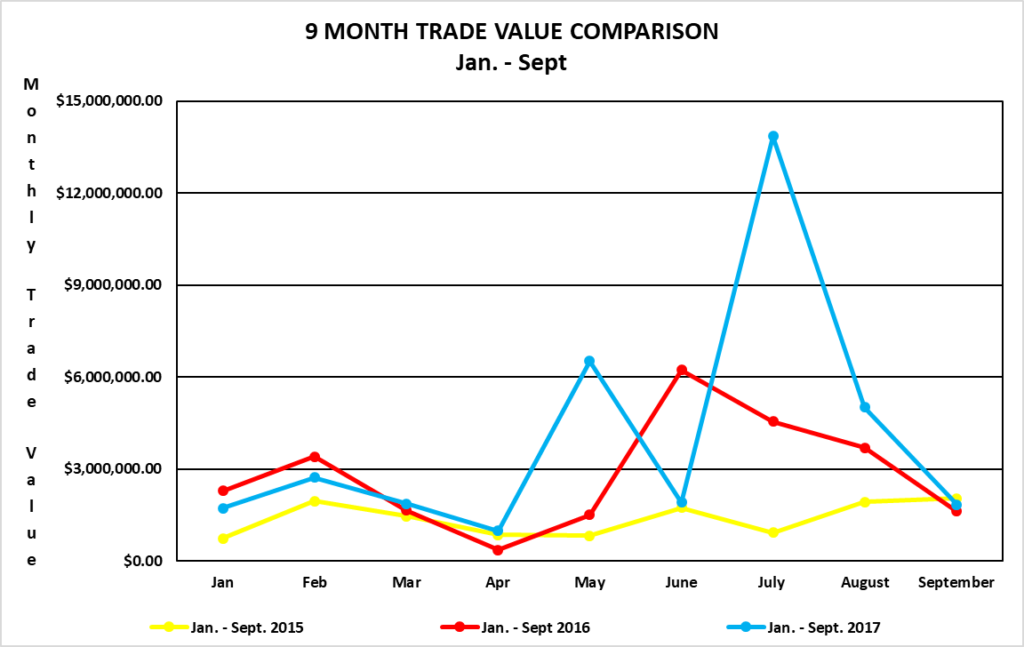
Trading volume for the nine-month period January 1, 2017 to September 29, 2017 was 3,414,260 securities for a value of $36,445,020.43. By comparison, trading volume for the nine-month period January 1, 2016 to September 30, 2016 was 3,813,602 securities for a value of $25,321,904.16.
Trading volume for the three-month period July 1, 2017 to September 29, 2017 was 1,063,957 securities for a value of $20,708,119.53. By comparison, trading volume for the three-month period July 1, 2016 to September 30, 2016 was 852,915 securities for a value of $9,871,095.51.
AVERAGE DAILY VOLUME AND VALUE
For the nine-month period from January 1, 2017 to September 29, 2017, the average volume per trading day was 17,811 securities for a value of $193,974.17. By comparison, for the nine-month period from January 1, 2016 to September 30, 2016, the average volume per trading day was 20,240 securities for an average value of $134,582.47.
| Month | Avg. volume / trading day (2017) | Avg. volume / trading day (2016) | Avg. value / trading day (2017) | Avg. value / trading day (2016) |
| January |
12,721 |
11,672 | $86,069.82 |
$114,183.37 |
| February |
25,474 |
21,979 | $135,899.61 |
$162,333.08 |
| March |
10,097 |
9,720 | $81,529.57 |
$78,322.27 |
| April |
3,125 |
2,381 | $54,795.52 |
$17,441.96 |
| May |
42,282 |
9,224 | $283,731.84 |
$72,052.88 |
| June |
16,271 |
86,565 | $95,509.03 |
$296,856.53 |
| July |
16,073 |
12,516 | $692,798.69 |
$216,668.07 |
| August |
23,177 |
16,697 | $228,043.63 |
$176,210.72 |
| September |
11,077 |
11,402 | $87,389.80 |
$77,173.38 |
| Average for period |
17,811 |
20,240 | $193,974.17 |
$134,582.47 |
VOLUME AND VALUE LEADERS (NINE MONTH PERIOD)
The top five volume leaders on BISX for the nine-month period January 1, 2017 to September 29, 2017 with their contribution to total traded volume displayed as a percentage were:
| SYMBOL |
TRADE VOLUME |
% OF VOLUME |
| CHL |
807,589 |
23.9% |
| CBL |
692,113 |
20.5% |
| AML |
632,644 |
18.7% |
| CAB |
398,520 |
11.8% |
| FCL |
290,116 |
8.6% |
The top five value leaders for the nine-month period January 1, 2017 to September 29, 2017 with their contribution to total traded value displayed as a percentage were:
| SYMBOL | TRADE VALUE |
% OF TRADE VALUE |
| CBL | $ 7,132,785.94 |
19.7% |
| BG0407 | $ 7,062,000.00 |
19.5% |
| CHL | $ 4,767,895.72 |
13.2% |
| BG0207 | $ 3,950,000.00 |
10.9% |
| AML | $ 2,757,998.12 |
7.6% |
VOLUME AND VALUE LEADERS (THREE MONTH PERIOD)
The top five volume leaders on BISX for the three-month period July 1, 2017 to September 30, 2017 with their contribution to total traded volume displayed as a percentage were:
| SYMBOL | TRADE VOLUME | % OF VOLUME |
| CBL |
389,860 |
36.6% |
| FCL |
150,321 |
14.1% |
| CAB |
137,387 |
12.9% |
| AML |
107,945 |
10.1% |
| CIB |
77,700 |
7.3% |
The top five value leaders for the three-month period July 1, 2017 to September 30, 2017 with their contribution to total traded value displayed as a percentage were:
| SYMBOL | TRADE VALUE |
% OF TRADE VALUE |
| BG0407 | $ 6,557,000.00 | 31.7% |
| CBL | $ 3,959,175.46 |
19.1% |
| BG0207 | $ 3,950,000.00 |
19.1% |
| FCL | $ 1,265,587.75 | 6.1% |
| BG0105 | $ 1,200,000.00 |
5.8% |

