A record was also set in the share of dividends distributed to the public – approximately 65% of total dividends totaling about NIS 26.5 billion, were paid to public shareholders (with the remainder distributed to controlling shareholders and interested parties).
Outstanding sector dividend yields were recorded in the financial Supersectors – Financial services sector (7.0%), banks sector (4.8%), and insurance sector (3.9%), as well as in the energy, oil, and gas sector (4.9%).
In 2025, an all-time record was set for dividend distributions by companies whose shares are traded on the Tel Aviv Stock Exchange (TASE). A total of 241 companies distributed dividends to their shareholders totaling approximately NIS 40.8 billion, surpassing the previous record of NIS 31.8 billion set in 2024.
Despite the geopolitical, security, and economic events in 2025, which as in 2024, increased capital market uncertainty and had negative impact on the local economy, TASE-listed companies demonstrated ongoing resilience. Their operations continued to grow, generating higher profits, that were distributed to shareholders in line with their dividend policies.
A record was also set in 2025 for dividends distributed to public shareholders. About 65% of total dividends, approximately NIS 26.5 billion, were paid to public investors, compared to about NIS 19.4 billion (about 61% of total dividends) paid to public investors in 2024. The remaining 35% was paid to controlling shareholders and interested parties. This rising share of public payouts reflects the growing trend of increasing float rate in listed companies.
The average dividend yield of listed companies in 2025 was approximately 2.7%, lower compared to previous years (3.0% in 2024 and ~2.9% in 2023). The decline in dividend yield is due to the sharp surge in share prices. While the total dividend distributed rose by about 28% compared to the previous year, the average market value of the companies increased by about 40% compared to the average in 2024.
The average dividend yield of the Tel-Div index shares stood at approximately 4.6% in 2025. The newly launched Tel-Div Aristocrat Index, launched in February 2025, to track companies with a consecutive 10-year consistent dividend distribution - posted approximately 4.2%. dividend yield.
There are currently 7 Tel-Div index tracking products (2 exchange-traded funds and 5 passive mutual funds), offering exposure to mid-to-large-cap companies with consistent dividend distribution. Consequently, the index delivers a higher dividend yield than major TASE flagship indices.
Companies traded on the Tel Aviv Stock Exchange typically adopt a dividend policy based on a fixed payout ratio of net profit each year or each quarter (unlike the US, where a per-share amount is typically declared). The dividends paid in 2025 were derived from their profits in the fourth quarter of 2024 and the first three quarters of 2025. The increase in total dividends distributed by listed companies is mainly due to a rise of over 40% in their profits over these four quarters compared to the former corresponding same period.
While in the US market there is a pronounced preference (in terms of amounts) for share buybacks over dividend distributions (the total buybacks by S&P 500 companies in the 12 months ending September 2025 were 53% higher than the total dividends distributed by them during the same period), Tel Aviv-listed companies clearly prefer dividend distributions over buybacks of their own shares (which are considered a “distribution” under the Israeli Companies Law).
The financial sector also stood out this year in the amounts of dividends distributed and in relatively high dividend yields.
Banks continued to lead among the top distributors, due to all-time high dividends, which constituted about a third of all dividends distributed by listed companies. The financial services sector registered the highest dividend yield among all sectors. The energy, oil, and gas sector also stood out this year with an average sectoral dividend yield of 4.9%.
Chart 1: Dividend Distribution by Years 2015-2025
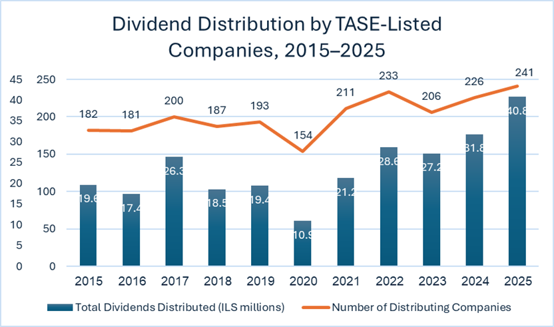
Table 1: Key Data on Dividend Distribution 2021-2025
|
2025 |
2024 |
2023 |
2022 |
2021 |
Item / Year |
|
241 |
226 |
206 |
233 |
211 |
Number of Distributing Companies |
|
44.5% |
42% |
39% |
43% |
39% |
Distributors share (out of Total Listed Companies) |
|
40.8 |
31.8 |
27.2 |
28.6 |
21.2 |
Total Dividends (NIS Billion) |
|
2.7% |
3.0% |
2.9% |
2.8% |
2.2% |
Dividend Yield |
|
1,501 |
1,075 |
933 |
1,028 |
979 |
Average Annual Market Cap (NIS Billion) |
Dividend Distribution – According to Key Stock Indices
TA-35 Index
A total of 25 companies whose shares were included in the TA-35 Index at year-end distributed dividends in 2025, totaling approximately NIS 23.2 billion. This represents about 57% of all dividends paid, resulting in an aggregate dividend yield of approximately 2.6%. By comparison, in 2024, 25 of the index companies similarly accounted for about 57% of total dividend distributions.
The highest dividend yields belong to Delek Group (8.0%), Phoenix (6.5%), Amot (6.0%), Bezeq (5.9%), and Shufersal (5.6%).
TA-90 Index
A total of 64 TA-90 Index constituents distributed approximately NIS 12.1 billion in 2025, accounting for roughly 30% of total dividend payouts. This compares to 60 index companies that distributed 29% of the total dividends in the previous year. The aggregate dividend yield for the TA-90 Index stood at 3.15% in 2025.
Notable dividend yields among index constituents were recorded by Isracard (28.8%), as well as companies within the energy, oil, and gas sector, which stood out also in the previous year. These include Kenon Holdings, which holds a controlling interest in OPC (14.5%), Energean PLC (9.7%), Ratio Energies LP (9.0%), Isramco LP (6.9%), and Paz Energy (6.9%).
Table 2: Dividend Distribution by Flagship Indices (2024–2025)
|
TA-35 |
TA-90 |
TA-125 |
|
|||
|
2025 |
2024 |
2025 |
2024 |
2025 |
2024 |
|
|
25 |
25 |
64 |
60 |
89 |
85 |
No. of Distributing Companies |
|
23.2 |
18.3 |
12.1 |
9.1 |
35.2 |
27.4 |
Total Dividends (NIS Billion) |
|
57% |
57% |
30% |
29% |
87% |
86% |
Share of Total Dividends (%) |
|
2.6% |
2.85% |
3.1% |
3.2% |
2.7% |
2.95% |
Dividend Yield (%) |
The largest dividend distributors in 2024 (by distribution amount)
At the top of the list of major dividend distributors are the large banks—Leumi, Poalim, Mizrahi-Tefahot, and Discount.
- Bank Leumi distributed the largest dividend in its history, totaling approximately NIS 3.9 billion in cash, more than 50% higher than its previous record set in 2024 of about NIS 2.6 billion. The bank recorded a dividend yield of approximately 4.3%, a decline compared to about 4.9% the previous year, mainly due to a sharp increase of about 69% in the share value during 2025.
The bank's policy is to distribute up to 50% of net profit each quarter alongside adopting share buyback programs. In November 2025, approval was given to distribute 75% of third-quarter profits, with about 1.5 billion shekels as a dividend and the remainder (about NIS 0.5 billion) through share buybacks.
- Bank Hapoalim distributed a record dividend in 2025, totaling approximately NIS 3.5 billion, more than 50% higher than the dividend distributed in the previous year. The average dividend yield was around 4.2% compared to about 4.7% the previous year. The decline, similar to Leumi, mainly due to a sharp rise (about 71%) in the share price.
In August, the bank updated its dividend distribution policy from up to 40% of quarterly net profit to up to 50%, including share buybacks, which amounted to approximately NIS 0.8 billion in 2025.
- Mizrahi-Tefahot, Discount, and First International Bank (FIBI) increased their distributed dividends to record levels and are ranked third, fourth, and seventh, respectively, with dividends of approximately NIS 2.5 billion, NIS 1.6 billion, and NIS 1.2 billion, respectively.
- Phoenix ranks fifth with a dividend of about NIS 1.5 billion, declared and paid according to a policy of distributing at least 40% of profit. The sharp increase in the dividend compared to 2024, when NIS 535 million were distributed, is mainly due to record profits, which reflected a high return on equity, a much higher solvency ratio than required, and strong cash flow. The company also conducted share buybacks.
- As part of the acquisition of control in the credit card company Isracard by Delek Group, the agreement included a special dividend distribution by Isracard totaling about NIS 1.3 billion, representing a dividend yield of about 29%.
- Delek Group paid quarterly dividends totaling about NIS 1 billion and recorded a high dividend yield of around 8%. The main source of funding for the paid dividends is dividend receipts from its subsidiary Ithaca, whose profits from the development and production of oil and gas assets in the North Sea surged in 2025, as well as profits distributed by the New-Med LP.
Dividend distribution in 2025 - by sectors
A high sectoral dividend yield was recorded in the financial Supersector, including banks, insurance companies, and financial services sector.
- The highest sectoral dividend yield in 2025 belongs to the Financial services sector (7.0%), due to to the special one-time dividend of NIS 1.3 billion distributed by Isracard, as mentioned above. Also contributed to the sector high yield are dividends distributed by most major investment houses and non-bank credit companies, which provided high dividend yields to their shareholders. The financial services sub-sector yielded a notable dividend yield of 7.6%.
- Banks continued to lead the major distributors, thanks to high cumulative dividends totaling about NIS 13.4 billion, which is approximately a third of all dividends distributed by publicly traded companies. The five largest banks, which showed high profitability continuing to reach record levels, distributed about 40% of their profits, totaling approximately NIS 31.7 billion (net profit attributable to shareholders in the fourth quarter of 2024 and the first three quarters of 2025, for which dividends were paid), compared to dividend payments of about NIS 8.9 billion in 2024, which constituted about 31% of their profits in the comparable four quarters. In addition to the dividends mentioned above, most banks adopted share buyback programs and conducted purchases during the year.
It should be noted that the increase in total dividends distributed by the banking system was aided by a Bank of Israel regulatory easing, which allowed banks in August to distribute dividends at 50% of profits instead of the previous 40% limit set due to war and geopolitical uncertainty conditions. Additionally, in November the Supervisor of Banks allowed banks with high capital surpluses to distribute an additional dividend (subject to meeting capital requirements and appropriate ratios), an easing that Bank Leumi and the International Bank adopted already in November 2025, distributing about 75% of third-quarter profits (including share buybacks), while Leumi updated its distribution policy in March 2026, increasing the dividend rate from 50% to 65%.
- The Insurance sector recorded a dividend yield of 3.9% due to dividends paid by eight out of nine insurance and financial companies. The total dividend distributed by companies in the sector, which registered a notable increase in profits in 2025, amounted to about NIS 3.4 billion. Standouts included Phoenix (NIS 1.5 billion, 6.5% dividend yield), Harel Investments (NIS 650 million, 4.1% dividend yield), Menorah Holdings (NIS 600 million, 3.5% dividend yield). The leading dividend yield in the sector belongs to Ayalon (8.6%).
Migdal Holdings, which distributed relatively low dividends in previous years derived from subsidiary Migdal Capital Markets profits, refrained from distributing dividends in 2025. The company does not benefit from dividend flows from its subsidiary Migdal Insurance, since it has been prevented in recent years from distributing dividends due to regulatory requirements.
A relatively high sectoral dividend yield was also recorded, similar to previous years, in the Energy, oil, and gas sector (4.9%), with the oil and gas exploration sub-sector yielding a notable 7.6% dividend yield. The total dividend distributed by companies in the sector amounted to about NIS 5.3 billion shekels. Standouts were oil and gas companies and partnerships: Delek Group and its controlled partnership New-Med Energy, Energean PLC and the Ratio Energies LP, as well as energy companies: Kenon (majority owner of OPC) and Paz Energy.
Table 3: Dividend Distributions by Sectors, 2024-2025
(In NIS Millions)
|
2025 |
2024 |
|
|||||
|
No. of Companies in Sector |
No. of Distributors |
Dividend Amount |
Sectoral Dividend Yield |
No. of Distributors |
Dividend Amount |
Sectoral Dividend Yield |
Sector |
|
8 |
8 |
13,377 |
4.8% |
7 |
9,378 |
4.8% |
Banks |
|
9 |
8 |
3,430 |
3.9% |
8 |
1,968 |
4.7% |
Insurance |
|
29 |
22 |
2,689 |
7.0% |
22 |
1,221 |
5.8% |
Financial Services |
|
46 |
38 |
19,496 |
4.8% |
37 |
12,567 |
4.9% |
Total Financial Super-Sector |
|
142 |
30 |
2,296 |
0.7% |
37 |
2,480 |
1.0% |
Technology |
|
40 |
2 |
46 |
0.04% |
0 |
0 |
0% |
Biomed |
|
184 |
32 |
2,342 |
0.5% |
37 |
2,480 |
0.8% |
Total High-Tech Super-Sector |
|
29 |
12 |
5,325 |
4.9% |
13 |
5,061 |
7.2% |
Energy, Oil & Gas |
|
57 |
34 |
2,345 |
2.3% |
31 |
2,244 |
3.0% |
Industry |
|
80 |
59 |
4,888 |
3.7% |
43 |
2,881 |
3.1% |
Commerce & Services |
|
115 |
54 |
5,703 |
2.0% |
49 |
5,031 |
2.3% |
Real Estate |
|
32 |
12 |
735 |
1.9% |
16 |
1,544 |
3.6% |
Investment & Holdings |
|
313 |
171 |
18,995 |
2.9% |
152 |
16,761 |
3.3% |
Total Real Super-Sector |
|
541 |
241 |
40,833 |
2.7% |
226 |
31,808 |
3.0% |
Total |
Chart 2: Dividend Distribution by Sector
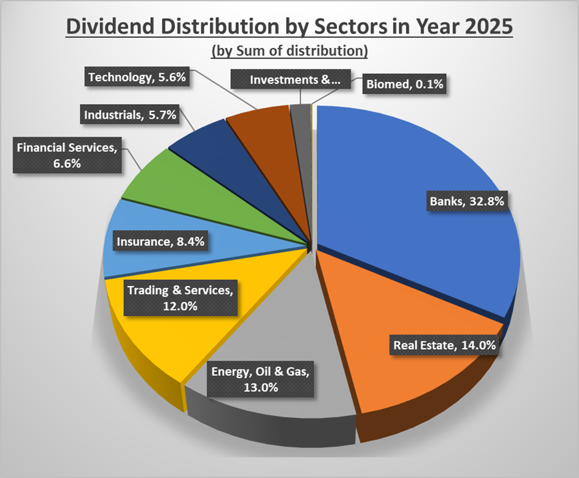
Table 4: Dividend Distribution and Yield - TA-35 Companies
(Dividend Amount in NIS Millions)
|
Dividend Amount 2025 |
Dividend Yield 2025 |
Dividend Amount 2024 |
Dividend Yield 2024 |
Dividend Amount 2023 |
Dividend Yield 2023 |
Company Name |
|
3,924 |
4.3% |
2,569 |
4.9% |
2,081 |
4.6% |
Leumi |
|
3,466 |
4.2% |
2,284 |
4.7% |
2,431 |
5.8% |
Poalim |
|
2,506 |
4.7% |
1,869 |
5.1% |
1,390 |
4.3% |
Mizrahi Tefahot |
|
1,638 |
4.2% |
1,153 |
4.5% |
1,047 |
4.4% |
Discount |
|
1,515 |
6.5% |
535 |
5.4% |
297 |
3.2% |
Phoenix |
|
1,195 |
5.3% |
989 |
6.2% |
798 |
5.5% |
FIBI |
|
1,035 |
8.0% |
940 |
11.3% |
1,100 |
14.1% |
Delek Group |
|
975 |
5.9% |
781 |
6.3% |
638 |
4.4% |
Bezeq |
|
834 |
4.7% |
918 |
7.9% |
947 |
8.0% |
NewMed Energy |
|
800 |
2.4% |
1,000 |
3.1% |
700 |
2.8% |
Azrieli Group |
|
768 |
2.8% |
919 |
4.1% |
1,758 |
6.0% |
ICL |
|
650 |
4.1% |
550 |
7.4% |
100 |
1.5% |
Harel Investments |
|
629 |
6.0% |
613 |
7.5% |
639 |
7.4% |
Amot |
|
600 |
3.5% |
460 |
6.8% |
175 |
3.6% |
Menora Mivtachim |
|
540 |
5.6% |
180 |
2.7% |
0 |
--- |
Shufersal |
|
390 |
0.6% |
330 |
1.0% |
327 |
1.1% |
Elbit Systems |
|
360 |
2.1% |
380 |
2.9% |
380 |
3.5% |
Melisron |
|
360 |
3.9% |
270 |
3.3% |
0 |
--- |
Strauss Group |
|
204 |
2.8% |
158 |
2.6% |
74 |
1.8% |
Dimri |
|
200 |
2.2% |
100 |
1.5% |
0 |
--- |
Clal Insurance |
|
200 |
1.2% |
0 |
--- |
0 |
--- |
BIG |
|
122 |
1.6% |
51 |
1.3% |
20 |
2.2% |
Next Vision |
|
96 |
0.6% |
107 |
0.7% |
99 |
0.6% |
Ormat Tech |
|
80 |
1.0% |
0 |
--- |
70 |
0.7% |
Shapir Engineering |
|
70 |
1.0% |
115 |
1.6% |
287 |
3.9% |
Mivne |
|
0 |
--- |
223 |
1.6% |
0 |
--- |
Camtek |
|
0 |
--- |
55 |
1.0% |
57 |
1.3% |
Migdal Insurance |
|
0 |
--- |
0 |
--- |
0 |
--- |
Navitas Petro |
|
0 |
--- |
0 |
--- |
0 |
--- |
OPC |
|
0 |
--- |
0 |
--- |
0 |
--- |
Teva |
|
0 |
--- |
0 |
--- |
0 |
--- |
Enlight |
|
0 |
--- |
0 |
--- |
0 |
--- |
Nova |
|
0 |
--- |
0 |
--- |
0 |
--- |
Tower |
|
0 |
--- |
0 |
--- |
0 |
--- |
NICE |
|
0 |
--- |
0 |
--- |
0 |
--- |
Fattal Holdings |
|
23,157 |
2.6% |
|
|
|
|
Total TA-35 |
|
25 |
|
|
|
|
|
No. of Distributing Companies
|
Methodology
The data in this review is based on corporate filings from the TASE "MAYA" website regarding cash dividend distributions. The figures were calculated according to the actual payment date of the dividends in each respective year.
Total and sectoral dividend yields are calculated based on the average market capitalization between the beginning and the end of the year. The dividend yield of individual companies is calculated based on the share price on the "Ex-date."
The data for each year does not include dividends distributed by companies whose shares were delisted from trading during that year.
The figures exclude foreign companies with no affiliation to Israel (Creative Media, PennantPark, UMH, Strawberry Inc., Sion, and Prospect), whose ordinary shares were listed on the TASE as part of debt or preferred share issuances and whose ordinary share trading volume is negligible.
Furthermore, the data does not include dividends in-kind distributed by listed companies.