Global financial market operators delivered strong results in August 2026, with record trading volumes and solid equity gains driven by elevated macroeconomic volatility - underscoring the sector's ability to profit from market turbulence.
The FTSE Mondo Visione Index closed August at 102,369.51 points, up 5.3% from its July close of 97,228.32, reaching an all-time closing high of 102,980.79 on 28 August 2026.
Top 5 Exchanges by Market Capitalisation (End of August 2026)
Exchange |
Market Cap (USD bn) |
| CME Group | 103.45 |
| Intercontinental Exchange | 90.88 |
| Hong Kong Exchanges & Clearing | 68.77 |
| Deutsche Boerse | 60.92 |
| London Stock Exchange Group | 60.28 |
Best and Worst Performers
Multi Commodity Exchange of India was the standout performer of the month, recording a 26.6 per cent increase in capital returns in U.S. dollars from 1 to 31 August 2026. Deutsche Boerse ranked second with a rise of 10.9 per cent, followed by Euronext Athens with a 10.5 per cent increase over the same period.
At the other end of the spectrum, India's BSE was the worst performer, recording a 9.8 per cent decrease in share price over the same period. Miami International Holdings posted the second-largest decline at 8.9 per cent, followed by Romania's S.C. Bursa de Valori Bucuresti S.A. with a 7.6 per cent decrease.
Industry Commentary
Herbie Skeete, Managing Director of Mondo Visione and Co-founder of the Index, commented:
Global exchange operators capitalised on heightened volatility in August 2026, delivering record trading volumes and strong equity gains as CME Group, ICE, and Deutsche Boerse outpaced broader benchmarks on surging institutional hedging.
Download the Report
The full August 2026 performance report is available to download here.
1-YEAR PERFORMANCE CHART OF THE FTSE MONDO VISIONE EXCHANGES INDEX (USD CAPITAL RETURN)
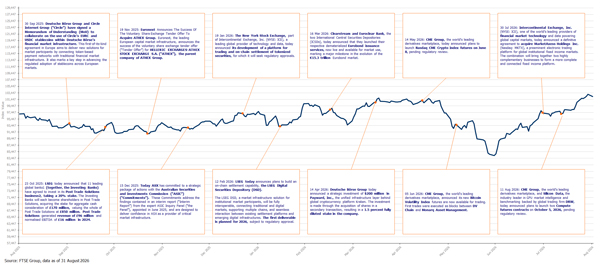
Source: FTSE Group, data as at 31 August 2026
Monthly FTSE Mondo Visione Exchanges Index Performance (Capital Return, USD)
|
July 2014 |
3.1% |
|
August 2014 |
2.3% |
|
September 2014 |
-3.6% |
|
October 2014 |
2.8% |
|
November 2014 |
2.5% |
|
December 2014 |
-0.5% |
|
January 2015 |
-1.0% |
|
February 2015 |
8.5% |
|
March 2015 |
0.0% |
|
April 2015 |
10.7% |
|
May 2015 |
0.1% |
|
June 2015 |
-3.2% |
|
July 2015 |
-2.7% |
|
August 2015 |
-5.3% |
|
September 2015 |
-2.1% |
|
October 2015 |
7.6% |
|
November 2015 |
0.4% |
|
December 2015 |
-2.2% |
|
January 2016 |
-4,7% |
|
February 2016 |
-0.7% |
|
March 2016 |
6.7% |
|
April 2016 |
0.4% |
|
May 2016 |
1.8% |
|
June 2016 |
-2.2% |
|
July 2016 |
5.3% |
|
August 2016 |
2.3% |
|
September 2016 |
-1.6% |
|
October 2016 |
-1.6% |
|
November 2016 |
2.1% |
|
December 2016 |
0.1% |
|
January 2017 |
6.0% |
|
February 2017 |
-0.8% |
|
March 2017 |
1.4% |
|
April 2017 |
0.8% |
|
May 2017 |
1.6% |
|
June 2017 |
5.6% |
|
July 2017 |
2.7% |
|
August 2017 |
0.3% |
|
September 2017 |
3.6% |
|
October 2017 |
-0.7% |
|
November 2017 |
6.4% |
|
December 2017 |
-0.7% |
|
January 2018 |
10% |
|
February 2018 |
-0.5% |
|
March 2018 |
-1.6% |
|
April 2018 |
-1.0% |
|
May 2018 |
-1.5% |
|
June 2018 |
-0.8% |
|
July 2018 |
-0.7% |
|
August 2018 |
2.4% |
|
September 2018 |
-1.7% |
|
October 2018 |
1.0% |
|
November 2018 |
3.1% |
|
December 2018 |
-4.2% |
|
January 2019 |
5.4% |
|
February 2019 |
1.7% |
|
March 2019 |
-2.6% |
|
April 2019 |
4.6% |
|
May 2019 |
1.5% |
|
June 2019 |
4.3% |
|
July 2019 |
2.2% |
|
August 2019 |
3.7% |
|
September 2019 |
-0.8% |
|
October 2019 |
2.0% |
|
November 2019 |
-0.5% |
|
December 2019 |
1.6% |
|
January 2020 |
5.0% |
|
February 2020 |
-7.4% |
|
March 2020 |
-11.5% |
|
April 2020 |
8.0% |
|
May 2020 |
6.7% |
|
June 2020 |
2.3% |
|
July 2020 |
6.6% |
|
August 2020 |
4.9% |
|
September 2020 |
-5.2% |
|
October 2020 |
-6.7% |
|
November 2020 |
8.9% |
|
December 2020 |
7.2% |
|
January 2021 |
0.8% |
|
February 2021 |
1.4% |
|
March 2021 |
-2.7% |
|
April 2021 |
3.3% |
|
May 2021 |
2.5% |
|
June 2021 |
0.4% |
|
July 2021 |
0.4% |
|
August 2021 |
0.1% |
|
September 2021 |
-4.2% |
|
October 2021 |
5.9% |
|
November 2021 |
-5.6% |
|
December 2021 |
4.9% |
|
January 2022 |
-2.2% |
|
February 2022 |
-3.5% |
|
March 2022 |
3.5% |
|
April 2022 |
-8.6% |
|
May 2022 |
-5.1% |
|
June 2022 |
-0.7% |
|
July 2022 |
2.4% |
|
August 2022 |
-3.9% |
|
September 2022 |
-8.8% |
|
October 2022 |
-1.1% |
|
November 2022 |
11.5% |
|
December 2022 |
-2.9% |
|
January 2023 |
3.8% |
|
February 2023 |
-4.1% |
|
March 2023 |
5.0% |
|
April 2023 |
0.9% |
|
May 2023 |
-3.9% |
|
June 2023 |
3.8% |
|
July 2023 |
4.6% |
|
August 2023 |
-2.3% |
|
September 2023 |
-3.0% |
|
October 2023 |
-0.6% |
|
November 2023 |
7.7% |
|
December 2023 |
3.8% |
|
January 2024 |
-2.7% |
|
February 2024 |
4.3% |
|
March 2024 |
-0.1% |
|
April 2024 |
-3.8% |
|
May 2024 |
1.3% |
|
June 2024 |
-0.4% |
|
July 2024 |
3.2% |
|
August 2024 |
8.2% |
|
September 2024 |
4.7% |
|
October 2024 |
-1.2% |
|
November 2024 |
2.6% |
|
December 2024 |
-3.1% |
|
January 2025 |
4.3% |
|
February 2025 |
5.6% |
|
March 2025 |
2.2% |
|
April 2025 |
3.5% |
|
May 2025 |
4.4% |
|
June 2025 |
0.8% |
|
July 2025 |
-2.9% |
|
August 2025 |
-0.7% |
|
September 2025 |
-3.1% |
|
October 2025 |
-3.2% |
|
November 2025 |
3.6% |
|
December 2025 |
-0.4% |
|
January 2026 |
3.2% |
|
February 2026 |
3.2% |
|
March 2026 |
-4.1% |
|
April 2026 |
5.0% |
|
May 2026 |
-3.4% |
|
June 2026 |
-12.8% |
|
July 2026 |
14.6% |
|
August 2026 |
5.3% |
About FTSE Mondo Visione Exchanges Index
The FTSE Mondo Visione Exchanges Index, a joint venture between FTSE Group and Mondo Visione, was established in 2000.
It is the first Index in the world to focus on listed exchanges and other trading venues. The FTSE Mondo Visione Exchanges Index compares performance of individual exchanges and trading platforms and provides a reliable barometer of the health and performance of the exchange sector.
It enables investors to track 33 publicly listed exchanges and trading floors and focuses attention of the market on this important sector.
The FTSE Mondo Visione Exchanges Index includes all publicly traded stock exchanges and trading floors:
- Australian Securities Exchange Ltd
- B3 SA
- Bolsa de Comercio Santiago
- Bolsa Mexicana de Valores SA
- Boursa Kuwait Securities
- BSE
- Bulgarian Stock Exchange
- Bursa de Valori Bucuresti SA
- Bursa Malaysia
- Cboe Global Markets
- CME Group
- Dar es Salaam Stock Exchange PLC
- Deutsche Bourse
- Dubai Financial Market
- Euronext
- Euronext Athens
- Hong Kong Exchanges and Clearing Ltd
- Intercontinental Exchange Inc
- Japan Exchange Group, Inc
- Johannesburg Stock Exchange Ltd
- London Stock Exchange Group
- Miami International Holdings
- Multi Commodity Exchange of India
- Nairobi Securities Exchange
- Nasdaq
- New Zealand Exchange Ltd
- Philippine Stock Exchange
- Saudi Tadawul Group
- Singapore Exchange Ltd
- Tel Aviv Stock Exchange
- TMX Group
- Warsaw Stock Exchange
- Zagreb Stock Exchange
The FTSE Mondo Visione Exchanges Index is compiled by FTSE Group from data based on the share price performance of listed exchanges and trading platforms.