After a positive start to the year, it has been a rough first quarter for exchange groups with over half of the constituents in negative territory over the quarter as the spectre of a US/China trade dispute cast a long shadow over markets.
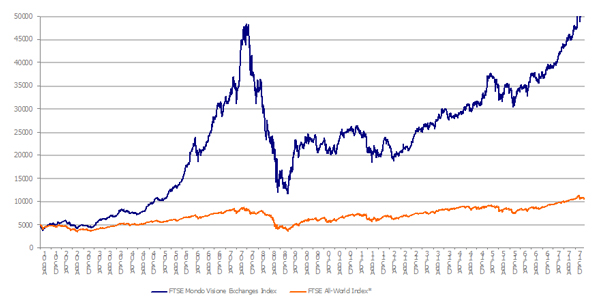
FTSE Mondo Visione Exchanges Index And The FTSE All-World Index Performance Since 17 August 2001 (USD Capital Return)

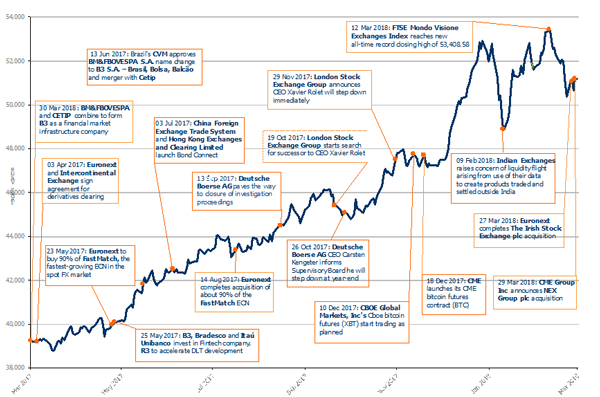
The Index, which aims to reflect market sentiment and is a key indicator of exchanges performance closed at 51,176.7 on 30 March 2018, down from 51,993.9 on 28 February 2018.
Herbie Skeete, Managing Director, Mondo Visione and also Co-founder of the Index said:
“To misquote Charles Dickens, for exchanges, it was one of those March days when the sun shines hot and the wind blows cold: when it is summer in the light, and winter in the shade. Spring fever it ain’t, but the CME/NEX deal shows that the era of cross-border exchange mega-mergers isn’t over. The question is, who or what’s NEX?”
The FTSE Mondo Visione Exchanges Index best performer in March by capital returns in US dollars was Nasdaq with a 6.8 per cent increase in share price from 28 February 2018 to 30 March 2018. The next best performers were Kenya’s Nairobi Securities Exchange with a 6.7 per cent increase and Japan Exchange Group with a 6.5 per cent increase over the same period.
The FTSE Mondo Visione Exchanges Index worst performer in March by capital returns in US dollars was the Multi Commodity Exchange of India with a 14.6 per cent decrease in share price from 28 February 2018 to 30 March 2018. This was followed by Hong Kong Exchanges & Clearing with a 10.4 per cent decline and South Africa’s JSE with a 9.5 per cent decrease over the same period.
The FTSE Mondo Visione Exchanges Index rose by 7.8 per cent in the first quarter of 2018 as opposed to a rise of 5.0 in the fourth quarter of 2017 and a rise of 6.5 per cent in the first quarter of 2017.
In Q1 2018, the FTSE Mondo Visione Exchanges Index best performer by capital returns in US dollars was the South Africa’s JSE with a 25.9 per cent increase in share price from January 1 to 30 March 2018. The next two best performers were Euronext with a 17.4% increase and Deutsche Boerse with a 17.0 per cent increase.
In Q1 2018, the FTSE Mondo Visione Exchanges Index worst performer by capital returns in US dollars was the Multi Commodity Exchange of India with a 28.4 per cent decrease in share price from January 1 to 30 March 2018. The next two worst performers at the bottom of the table were India’s BSE with an 18.6 per cent decrease and Poland’s Warsaw Stock Exchange with a 10.8 per cent decrease.
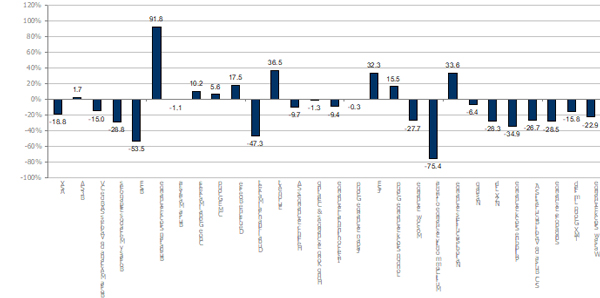
1 Year Constituent Performance Chart (USD Capital Return)

1 Year Excess Capital Returns Against The FTSE Mondo Visione Exchanges Index (USD Capital Return)

Click here to download March's performance report, including the quarterly analysis.
Monthly FTSE Mondo Visione Exchanges Index Performance (Capital Return, USD)

Monthly FTSE Mondo Visione Exchanges Index Performance (Capital Return, USD)
|
July 2014 |
3.1% |
|
August 2014 |
2.3% |
|
September 2014 |
-3.6% |
|
October 2014 |
2.8% |
|
November 2014 |
2.5% |
|
December 2014 |
-0.5% |
|
January 2015 |
-1.0% |
|
February 2015 |
8.5% |
|
March 2015 |
0.0% |
|
April 2015 |
10.7% |
|
May 2015 |
0.1% |
|
June 2015 |
-3.2% |
|
July 2015 |
-2.7% |
|
August 2015 |
-5.3% |
|
September 2015 |
-2.1% |
|
October 2015 |
7.6% |
|
November 2015 |
0.4% |
|
December 2015 |
-2.2% |
|
January 2016 |
-4,7% |
|
February 2016 |
-0.7% |
|
March 2016 |
6.7% |
|
April 2016 |
0.4% |
|
May 2016 |
1.8% |
|
June 2016 |
-2.2% |
|
July 2016 |
5.3% |
|
August 2016 |
2.3% |
|
September 2016 |
-1.6% |
|
October 2016 |
-1.6% |
|
November 2016 |
2.1% |
|
December 2016 |
0.1% |
|
January 2017 |
6.0% |
|
February 2017 |
-0.8% |
|
March 2017 |
1.4% |
|
April 2017 |
0.8% |
|
May 2017 |
1.6% |
|
June 2017 |
5.6% |
|
July 2017 |
2.7% |
|
August 2017 |
0.3% |
|
September 2017 |
3.6% |
|
October 2017 |
-0.7% |
|
November 2017 |
6.4% |
|
December 2017 |
-0.7% |
|
January 2018 |
10% |
|
February 2018 |
-0.5% |
|
March 2018 |
-1.6% |
About FTSE Mondo Visione Exchanges Index
The FTSE Mondo Visione Exchanges Index, a joint venture between FTSE Group and Mondo Visione, was established in 2000.
It is the first Index in the world to focus on listed exchanges and other trading venues. The FTSE Mondo Visione Exchanges Index compares performance of individual exchanges and trading platforms and provides a reliable barometer of the health and performance of the exchange sector.
It enables investors to track 28 publicly listed exchanges and trading floors and focuses attention of the market on this important sector.
The FTSE Mondo Visione Exchanges Index includes all publicly traded stock exchanges and trading floors:
- Australian Securities Exchange Ltd
- B3 SA
- Bolsa Mexicana de Valores SA
- Bolsa y Mercado Espanoles
- BSE
- Bulgarian Stock Exchange
- Bursa de Valori Bucuresti SA
- Bursa Malaysia
- Cboe Global Markets
- CME Group
- Deutsche Bourse
- Dubai Financial Market
- Euronext
- Hellenic Exchanges SA
- Hong Kong Exchanges and Clearing Ltd
- Intercontinental Exchange Inc
- Japan Exchange Group, Inc
- Johannesburg Stock Exchange Ltd
- London Stock Exchange Group
- Moscow Exchange
- Multi Commodity Exchange of India
- Nairobi Securities Exchange
- Nasdaq
- New Zealand Exchange Ltd
- Philippine Stock Exchange
- Singapore Exchange Ltd
- TMX Group
- Warsaw Stock Exchange
The FTSE Mondo Visione Exchanges Index is compiled by FTSE Group from data based on the share price performance of listed exchanges and trading platforms.


