Shares of exchange operators have mostly performed well over pass six months with the FTSE Mondo Visione Exchanges Index up by 25% over six months. The engine for exchanges has been elevated trading levels.
The three months to the end of September saw the FTSE Mondo Visione Exchanges Index up by 6.0%. Multi Commodity Exchange the world's largest commodity exchange by volume was the best performing exchange in the quarter with CBOE Global markets being the worst performer.
The FTSE Mondo Visione Exchanges Index ended the month down 5.2% at 66,604.18 points, down from 70,221.41 on 31 August 2020.
CME Group ended September as the world's largest exchange operator by market capitalisation.
The top 5 exchanges by market capitalisation at end September were:
| Exchange | Market Cap (USD bn) |
| CME Group | 59.28 |
| Hong Kong Exchanges & Clearing | 59.19 |
| Intercontinental Exchange | 53.92 |
| London Stock Exchange Group | 36.10 |
| Deutsche Boerse | 32.22 |
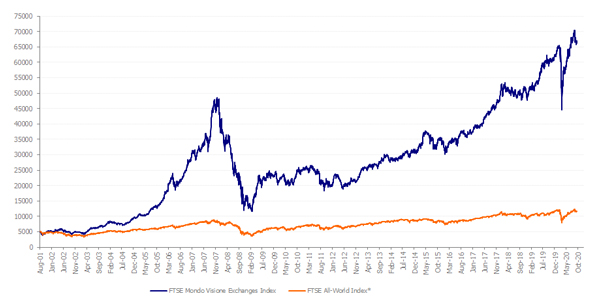
FTSE MONDO VISIONE EXCHANGES INDEX AND THE FTSE ALL-WORLD INDEX PERFORMANCE SINCE 17 AUGUST 2001 (USD CAPITAL RETURN)

Herbie Skeete, Managing Director, Mondo Visione and Co-founder of the Index said:
"The quarter ending with Euronext in pole position with London Stock Exchange Group for the acquisition of Borsa Italiana, The sale of Borsa Italian is one of the EU Competition Authorities conditions for the LSEG's merger with Refinitiv. Meanwhile on the other side of the Atlantic, the share prices of US exchanges have been impacted by the state of New Jersey's proposed financial transaction tax law, and the launch of three new competing stock exchanges, Long-Term Stock Exchange launched on 17 September; Members Exchange launched on 21 September and MIAX PEARL Equities launched on 29 September. U.S. stock exchanges have made known to New Jersey that if the financial transaction tax is implemented, they will relocate their primary data centres, where billions of dollars of trades are executed daily. All of the U.S. stock exchanges have their disaster recovery sites in the same building in Chicago, New Jersey's loss may be Chicago's gain. It might also make it harder for HFT traders to exploit latency arbitrage."
Nairobi Securities Exchange was the best performer in September by capital returns in US dollars with a 13.1 per cent increase in share price from 31 August 2020 to 30 September 2020. The next two best performers were India's BSE with a 9.3 per cent increase and the Bolsa Mexicana de Valores SAB de CV with a 7.8 per cent increase over the same period.
The FTSE Mondo Visione Exchanges Index worst performer in September by capital returns in US dollars was Bursa Malaysia with a 12.3 per cent decrease in share price from 31 August 2020 to 30 September 2020. The next two worst performers at the bottom of the table were Bulgarian Stock Exchange with a 11.4 per cent decrease and ASX with a 10.1 per cent decrease over the same period.
The FTSE Mondo Visione Exchanges Index rose by 6.0 per cent in the third quarter of 2020 as opposed to a rise of 17.9 per cent in the second quarter of 2020 and a rise of 5.1 per cent in the third quarter of 2019.
In Q3 2020, the FTSE Mondo Visione Exchanges Index best performer by capital returns in US dollars was Multi Commodity Exchange of India with a 37.3 per cent increase in share price from 1 July to 30 September 2020. The next two best performers were India’s BSE with a 25.9 per cent increase and Euronext with a 25.1 per cent increase.
In Q3 2020, the FTSE Mondo Visione Exchanges Index worst performer by capital returns in US dollars was Cboe Global Markets with a 5.9 per cent decrease in share price from 1 July to 30 September 2020. The next two worst performers at the bottom of the table were Hellenic Exchanges SA with a 4.2 per cent decrease and Philippine Stock Exchange with a 3.9 per cent decrease.
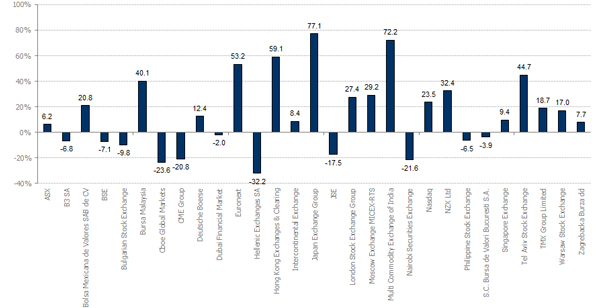
1 YEAR CONSTITUENT PERFORMANCE (USD CAPITAL RETURN)

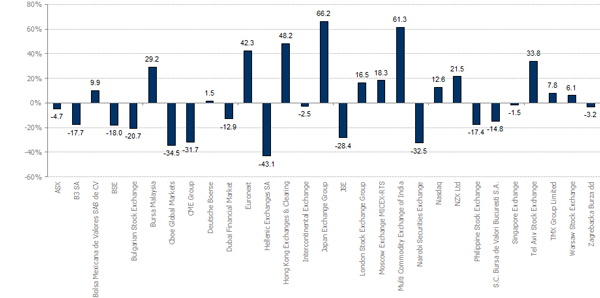
1 YEAR EXCESS CAPITAL RETURNS AGAINST THE FTSE MONDO VISIONE EXCHANGES INDEX (USD CAPITAL RETURN)

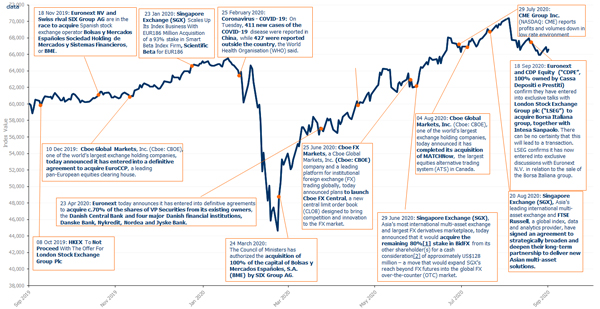
1-YEAR PERFORMANCE CHART OF THE FTSE MONDO VISIONE EXCHANGES INDEX (USD CAPITAL RETURN)

Click here to download September's performance report, including the quarterly analysis.
Monthly FTSE Mondo Visione Exchanges Index Performance (Capital Return, USD)
|
July 2014 |
3.1% |
|
August 2014 |
2.3% |
|
September 2014 |
-3.6% |
|
October 2014 |
2.8% |
|
November 2014 |
2.5% |
|
December 2014 |
-0.5% |
|
January 2015 |
-1.0% |
|
February 2015 |
8.5% |
|
March 2015 |
0.0% |
|
April 2015 |
10.7% |
|
May 2015 |
0.1% |
|
June 2015 |
-3.2% |
|
July 2015 |
-2.7% |
|
August 2015 |
-5.3% |
|
September 2015 |
-2.1% |
|
October 2015 |
7.6% |
|
November 2015 |
0.4% |
|
December 2015 |
-2.2% |
|
January 2016 |
-4,7% |
|
February 2016 |
-0.7% |
|
March 2016 |
6.7% |
|
April 2016 |
0.4% |
|
May 2016 |
1.8% |
|
June 2016 |
-2.2% |
|
July 2016 |
5.3% |
|
August 2016 |
2.3% |
|
September 2016 |
-1.6% |
|
October 2016 |
-1.6% |
|
November 2016 |
2.1% |
|
December 2016 |
0.1% |
|
January 2017 |
6.0% |
|
February 2017 |
-0.8% |
|
March 2017 |
1.4% |
|
April 2017 |
0.8% |
|
May 2017 |
1.6% |
|
June 2017 |
5.6% |
|
July 2017 |
2.7% |
|
August 2017 |
0.3% |
|
September 2017 |
3.6% |
|
October 2017 |
-0.7% |
|
November 2017 |
6.4% |
|
December 2017 |
-0.7% |
|
January 2018 |
10% |
|
February 2018 |
-0.5% |
|
March 2018 |
-1.6% |
|
April 2018 |
-1.0% |
|
May 2018 |
-1.5% |
|
June 2018 |
-0.8% |
|
July 2018 |
-0.7% |
|
August 2018 |
2.4% |
|
September 2018 |
-1.7% |
|
October 2018 |
1.0% |
|
November 2018 |
3.1% |
|
December 2018 |
-4.2% |
|
January 2019 |
5.4% |
|
February 2019 |
1.7% |
|
March 2019 |
-2.6% |
|
April 2019 |
4.6% |
|
May 2019 |
1.5% |
|
June 2019 |
4.3% |
|
July 2019 |
2.2% |
|
August 2019 |
3.7% |
|
September 2019 |
-0.8% |
|
October 2019 |
2.0% |
|
November 2019 |
-0.5% |
|
December 2019 |
1.6% |
|
January 2020 |
5.0% |
|
February 2020 |
-7.4% |
|
March 2020 |
-11.5% |
|
April 2020 |
8.0% |
|
May 2020 |
6.7% |
|
June 2020 |
2.3% |
|
July 2020 |
6.6% |
|
August 2020 |
4.9% |
|
September 2020 |
-5.2% |
About FTSE Mondo Visione Exchanges Index
The FTSE Mondo Visione Exchanges Index, a joint venture between FTSE Group and Mondo Visione, was established in 2000.
It is the first Index in the world to focus on listed exchanges and other trading venues. The FTSE Mondo Visione Exchanges Index compares performance of individual exchanges and trading platforms and provides a reliable barometer of the health and performance of the exchange sector.
It enables investors to track 29 publicly listed exchanges and trading floors and focuses attention of the market on this important sector.
The FTSE Mondo Visione Exchanges Index includes all publicly traded stock exchanges and trading floors:
- Australian Securities Exchange Ltd
- B3 SA
- Bolsa Mexicana de Valores SA
- BSE
- Bulgarian Stock Exchange
- Bursa de Valori Bucuresti SA
- Bursa Malaysia
- Cboe Global Markets
- CME Group
- Deutsche Bourse
- Dubai Financial Market
- Euronext
- Hellenic Exchanges SA
- Hong Kong Exchanges and Clearing Ltd
- Intercontinental Exchange Inc
- Japan Exchange Group, Inc
- Johannesburg Stock Exchange Ltd
- London Stock Exchange Group
- Moscow Exchange
- Multi Commodity Exchange of India
- Nairobi Securities Exchange
- Nasdaq
- New Zealand Exchange Ltd
- Philippine Stock Exchange
- Singapore Exchange Ltd
- Tel Aviv Stock Exchange
- TMX Group
- Warsaw Stock Exchange
- Zagreb Stock Exchange
The FTSE Mondo Visione Exchanges Index is compiled by FTSE Group from data based on the share price performance of listed exchanges and trading platforms.


