- The volume of trading in all derivatives was 1.5 million instruments in June 2013.
- The number of open interest was 197.9 thousand at the end of June 2013.
WIG20 futures
- The volume of trading in WIG20 futures was 1.05 million contracts in June 2013.
- The number of open interest in WIG20 futures was 103.8 thousand contracts at the end of June 2013.
Options
- The volume of trading in WIG20 options was 91.5 thousand options in June 2013;
- The number of open interest in options was 35.9 thousand options at the end of June 2013.
Single-stock futures
- The volume of trading in single-stock futures was 60.3 thousand contracts in June 2013;
- The number of open interest in single-stock futures was 9.1 thousand contracts at the end of June 2013;
- The most traded single-stock futures in June were:
No. Underlying Trading volume (#) in June 2013
- 1. PKO BP SA 20 822
- 2. KGHM S.A. 17 956
- 3. PKN ORLEN SA 6 849
- 4. PGE SA 2 877
- 5. PZU SA 2 575
Currency futures
- The volume of trading in currency futures was 314.9 thousand contracts in June 2013*;
- The most traded currency futures in June 2013 were USD/PLN futures. The volume of trading in USD/PLN futures was 254.8 thousand contracts, representing 81.0% of the volume of trading in all currency futures;
- The number of open interest in currency futures was 38.8 thousand contracts at the end of June 2013.
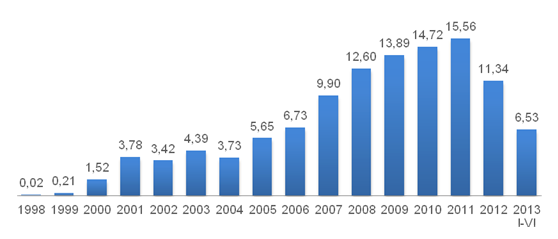
For more statistics, see Table 1 and Figures 1 and 2 below.
*All figures concerning trade in derivatives include the change in the standard specification of currency futures contracts as of 1 May 2012 whereby the size of such contracts was divided by 10.
Table 1
Volume of trading (including block trades):
- in June 2013;
- in July 2012 – June 2013;
- number of open interest (NOI) at the end of June 2013.
|
No. |
INSTRUMENT |
VOLUME OF TRADING (#) |
NOI (#) |
||||||||||
|
JUNE |
JAN - JUNE 2013 |
JAN - JUNE 2012 |
CHANGE |
LAST 12 MONTHS JUL'12-JUN'13 |
2012 |
CHANGE |
END OF JUNE |
||||||
|
2013 |
2012 |
CHANGE |
(%) |
(%) |
2013 |
2012 |
CHANGE |
||||||
|
(%) |
(%) |
||||||||||||
|
1 |
WIG20 FUTURES |
1 046 581 |
1 021 297 |
2,48% |
4 312 787 |
5 058 805 |
-14,75% |
8 331 022 |
9 077 040 |
-8,22% |
103 769 |
98 174 |
5,70% |
|
2 |
mWIG40 FUTURES |
6 555 |
1 262 |
419,41% |
19 491 |
7 643 |
155,02% |
25 896 |
14 048 |
84,34% |
864 |
300 |
188,00% |
|
3 |
SINGLE STOCK FUTURES |
60 255 |
38 929 |
54,78% |
373 496 |
268 408 |
39,15% |
645 418 |
540 330 |
19,45% |
9 064 |
8 708 |
4,09% |
|
4 |
CURRENCY FUTURES |
314 851 |
113 407 |
177,63% |
1 414 034 |
300 395 |
370,72% |
2 074 574 |
960 935 |
115,89% |
38 806 |
16 441 |
136,03% |
|
5 |
WIG20 OPTIONS |
91 534 |
65 316 |
40,14% |
408 882 |
297 730 |
37,33% |
826 516 |
715 364 |
15,54% |
35 931 |
26 508 |
35,55% |
|
6 |
INDEX PARTICIPATION UNITS |
829 |
6 033 |
-86,26% |
4 639 |
17 118 |
-72,90% |
16 131 |
28 610 |
-43,62% |
9 444 |
11 008 |
-14,21% |
|
TOTAL |
1 520 605 |
1 246 244 |
22,02% |
6 533 329 |
5 950 099 |
9,80% |
11 919 557 |
11 336 327 |
5,14% |
197 878 |
161 139 |
22,80% |
|
Figure 1
Annual volume of trading (including block trades) in all derivative instruments listed on the WSE in 1998 – June 2013 (million instruments).


