- The total volume of trading in all derivatives was 878.2 thousand instruments in January
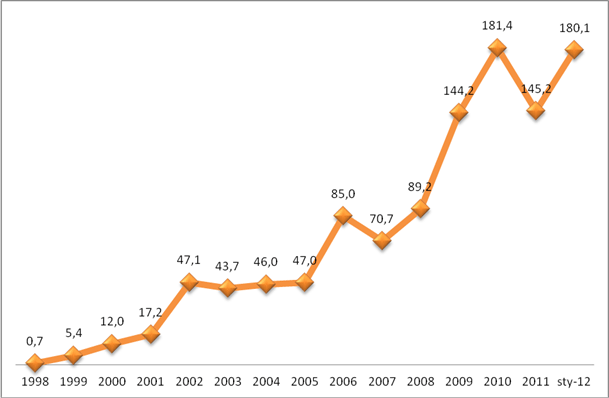
- The number of open interest was 180.1 thousand instruments at the end of January.
WIG20 futures
- The volume of trading in WIG20 futures was 767.5 thousand contracts in January;
- The number of open interest in WIG20 futures was 121 thousand contracts at the end of January.
Options
- The volume of trading in WIG20 index options was 35.4 thousand options in January;
- The volume of trading in the last 12 months (February 2011 – January 2012) was 846.5 thousand options;
- The number of open interest in WIG20 options was 34.3 thousand options at the end of January.
Single stock futures
- The volume of trading in single stock futures was 52.8 thousand contracts in January;
- The number of open interest in single stock futures was 8.5 thousand contracts at the end of January;
- The most traded single stock futures in January were:
No. Underlying Trading volume (#) in January 2012
- PKO BP SA 16 437
- KGHM SA 13 460
- PETROLINVEST SA 7 045
- PKN ORLEN SA 6 317
- LOTOS SA 1 799
Currency futures
- The total volume of trading in currency futures was 18.7 thousand contracts in January, an increase of 115% year on year;
- The most traded currency futures in January were USD/PLN futures: the volume of trading in USD/PLN futures was 14.6 thousand contracts;
- The number of open interest in currency futures was 2.8 thousand contracts, an increase of 51% year on year.
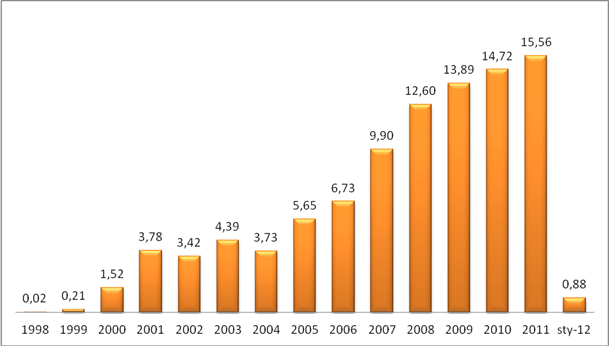
For more statistics, see Table 2 and Figures 1 and 2 below.
Derivative instruments are the most effective tool which can be used to manage specific risks. Derivatives based on indices and single stocks can be used to manage market risk, for instance to hedge an existing equities portfolio against a decrease in value. Currency futures can be used to hedge against the risk of disadvantageous changes of an exchange rate. This means that derivatives can be used for instance by entities which hold specific currency positions with respect to the following exchange rates: USD/PLN, EUR/PLN, CHF/PLN. Particularly important are options, which provide great flexibility in building hedging strategies. The WSE lists options which expire on four different dates; many series of call and put options with different strike prices are available for each expiry date. The diversity of available instruments opens great opportunities for hedging strategies. Options can be used to build hedging strategies according to different market scenarios and at a different cost of hedging.
Derivative instruments are also an effective investment tool. Derivatives can be profitable when the value of the underlying instrument increases or decreases. Investments in derivatives involve a high leverage. Again, options are particularly important due to their flexibility. Options can be used not only to invest in an expected change of value of the underlying instrument but also a change of market volatility etc. Arbitrage strategies, employed mainly by institutional investors, are a special variety of investment strategies.
Table 2
Volume of trading (including block trades):
- in January 2012;
- in the last 12 months (February 2011 – January 2012);
- number of open interest (NOI) at the end of January 2012.
|
No. |
INSTRUMENT |
VOLUME OF TRADING (#) |
NOI |
|||||||
|
(#) |
||||||||||
|
|
||||||||||
|
JANUARY |
LAST 12 MONTHS |
2011 |
CHANGE |
end of JANUARY |
||||||
|
2011 |
2010 |
CHANGE |
(FEB'11 - JAN'12) |
(%) |
2012 |
2011 |
CHANGE |
|||
|
(%) |
|
(%) |
||||||||
|
1 |
WIG20 FUTURES |
767 492 |
1 170 914 |
-34.45% |
13 238 860 |
13 642 282 |
-2.96% |
121 009 |
110 487 |
9.52% |
|
2 |
mWIG40 FUTURES |
1 296 |
2 704 |
-52.07% |
28 031 |
29 439 |
-4.78% |
526 |
797 |
-34.00% |
|
3 |
SINGLE STOCK FUTURES |
52 792 |
56 356 |
-6.32% |
734 178 |
737 742 |
-0.48% |
8 522 |
8 249 |
3.31% |
|
4 |
CURRENCY FUTURES |
18 741 |
8 727 |
114.75% |
209 504 |
199 490 |
5.02% |
2 845 |
1 884 |
51.01% |
|
5 |
WIG20 OPTIONS |
35 388 |
86 720 |
-59.19% |
846 469 |
897 801 |
-5.72% |
34 301 |
85 066 |
-59.68% |
|
6 |
WIG20 INDEX PARTICIPATION UNITS |
2 460 |
2 616 |
-5.96% |
49 884 |
50 040 |
-0.31% |
12 912 |
12 868 |
0.34% |
|
|
TOTAL |
878 169 |
1 328 037 |
-33.87% |
15 106 926 |
15 556 794 |
-2.89% |
180 115 |
219 351 |
-17.89% |
Source: WSE
Figure 1
Annual volume of trading (including block trades) in all derivative instruments listed on the WSE in 1998 – January 2012 (million instruments).

Source: WSE
Figure 2
Total number of open interest in all derivative instruments at year-end and at the end of January 2012 (thousand instruments).

Source: WSE


