WIG20 futures
- The volume of trading in WIG20 futures was 686.4 thousand contracts in February;
- The number of open interest in WIG20 futures was 132.1 thousand contracts at the end of February. This was a record-high number of open interest at month end.
Options
- The volume of trading in WIG20 options was 43.1 thousand options in February;
- The volume of trading in the last 12 months (March 2011 – February 2012) was 825.5 thousand options;
- The number of open interest in WIG20 options was 45.7 thousand options at the end of February.
Single-stock futures
- The volume of trading in single-stock futures was 43.2 thousand contracts in February;
- The number of open interest in single-stock futures was 12.4 thousand contracts at the end of February;
- The most traded single-stock futures were:
No. Underlying Trading volume (#) in February 2012
1. PKO BP SA 12 337
2. KGHM SA 11 571
3. PKN ORLEN SA 5 918
4. PGE SA 2 570
5. PETROLINVEST SA 2 226
Currency futures
- The volume of trading in currency futures was 21.6 thousand contracts in February, an increase of 160% year on year;
- The most traded currency futures in February were USD/PLN futures. The volume of trading in USD/PLN futures was 19.4 thousand contracts;
- The number of open interest in currency futures was 3.6 thousand contracts, an increase of 44.6% year on year.
Table 2
Volume of trading (including block trades):
· in February 2012;
· in January-February 2012;
· in the last 12 months (March 2011 – February 2012);
· number of open interest (NOI) at the end of February 2012.
|
No. |
INSTRUMENT |
|
NOI |
||||||||||
|
VOLUME OF TRADING |
(#) |
||||||||||||
|
(#) |
|
||||||||||||
|
FEBRUARY |
JANUARY-FEBRUARY |
LAST 12 MONTHS |
2011 |
CHANGE |
end of FEBRUARY |
||||||||
|
2012 |
2011 |
CHANGE |
2012 |
2011 |
CHANGE |
(MAR'11 - FEB'12) |
(%) |
2012 |
2011 |
CHANGE |
|||
|
(%) |
(%) |
|
(%) |
||||||||||
|
1 |
WIG20 FUTURES |
686 417 |
904 991 |
-24.15% |
1 453 909 |
2 075 905 |
-29.96% |
13 020 286 |
13 642 282 |
-4.56% |
132 138 |
98 409 |
34.27% |
|
2 |
mWIG40 FUTURES |
1 312 |
2 034 |
-35.50% |
2 608 |
4 738 |
-44.96% |
27 309 |
29 439 |
-7.24% |
502 |
815 |
-38.40% |
|
3 |
SINGLE STOCK FUTURES |
43 217 |
47 758 |
-9.51% |
96 009 |
104 114 |
-7.78% |
729 637 |
737 742 |
-1.10% |
12 377 |
9 354 |
32.32% |
|
4 |
CURRENCY FUTURES |
21 562 |
8 292 |
160.03% |
40 303 |
17 019 |
136.81% |
222 774 |
199 490 |
11.67% |
3 609 |
2 496 |
44.59% |
|
5 |
WIG20 OPTIONS |
43 124 |
64 073 |
-32.70% |
78 512 |
150 793 |
-47.93% |
825 520 |
897 801 |
-8.05% |
45 676 |
108 198 |
-57.78% |
|
6 |
WIG20 INDEX PARTICIPATION UNITS |
829 |
2 616 |
-68.31% |
3 289 |
3 381 |
-2.72% |
49 948 |
50 040 |
-0.18% |
13 359 |
13 073 |
2.19% |
|
|
TOTAL |
796 461 |
1 029 764 |
-22.66% |
1 674 630 |
2 355 950 |
-28.92% |
14 875 474 |
15 556 794 |
-4.38% |
207 661 |
232 345 |
-10.62% |
Source: WSE
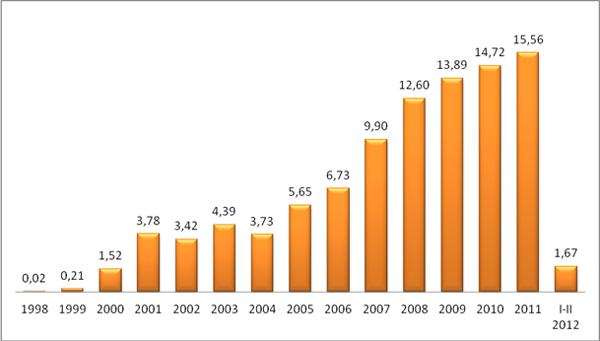
Figure 1
Annual volume of trading (including block trades) in all derivative instruments listed on the WSE in 1998 – February 2012 (million instruments).

Source: WSE
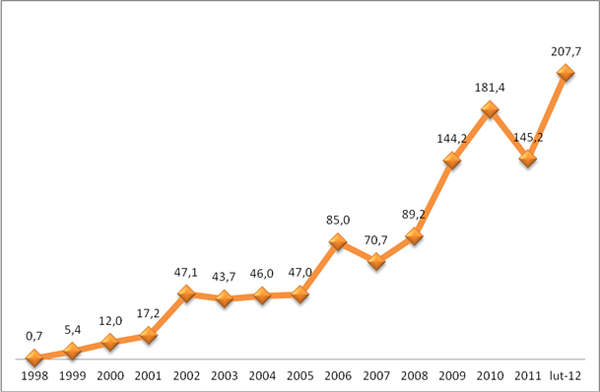
Figure 2
Total number of open interest in all derivative instruments at year-end and at the end of February 2012 (thousand instruments).

Source: WSE


