As of September 28, 2012 stock market indices in Europe, Asia, the U.S. and globally were up in September, according to global index provider STOXX Limited. For the month of August, the Asia, European, U.S. and global markets were up 2.37%, 0.85%, 0.37% and 0.82%, respectively. The full performance report is below.
Key global indicators:
|
Index |
Index close September 28, 2012 |
Point change MTD |
Performance MTD |
Performance YTD |
|
STOXX Global 3000 Index |
105,22 |
0,86 |
0,82% |
11,84% |
|
Best global supersector in September |
74.26 |
3.79 |
5.38% |
-3.43% |
|
Worst global supersector in September |
120.98 |
-1.76 |
-1.43% |
10.71% |
|
STOXX Americas 1200 Index |
115,05 |
0,42 |
0,37% |
14,20% |
|
STOXX Asia 1200 Index |
93,48 |
2,16 |
2,37% |
7,98% |
|
STOXX Europe 600 Index |
268,48 |
2,25 |
0,85% |
9,79% |
|
EURO STOXX 50 Index |
2454,26 |
13,55 |
0,56% |
5,94% |
Regional Indices:
|
Index |
Index close September 28, 2012 |
Point change MTD |
Performance MTD |
Performance YTD |
|
STOXX All Europe 100 Index |
951,71 |
4,96 |
0,52% |
7,33% |
|
STOXX Europe 50 Index |
2518,19 |
9,36 |
0,37% |
6,27% |
The three best and worst performing supersectors from the STOXX Europe 600 Index in September:
|
Index |
Index close September 28, 2012 |
Point change MTD |
Performance MTD |
Performance YTD |
|
Best: |
|
|
|
|
|
STOXX Europe 600 Chemicals Index |
633.56 |
30.23 |
5.01% |
23.46% |
|
STOXX Europe 600 Banks Price Index |
147.70 |
6.99 |
4.97% |
11.44% |
|
STOXX Europe 600 Financial Services Index |
239.06 |
9.40 |
4.09% |
14.16% |
|
Worst: |
|
|
|
|
|
STOXX Europe 600 Personal & Household Goods Index |
476.54 |
-19.11 |
-3.86% |
12.68% |
|
STOXX Europe 600 Oil & Gas Index |
338.62 |
-5.47 |
-1.59% |
0.38% |
|
STOXX Europe 600 Retail Index |
261.78 |
-3.34 |
-1.26% |
4.77% |
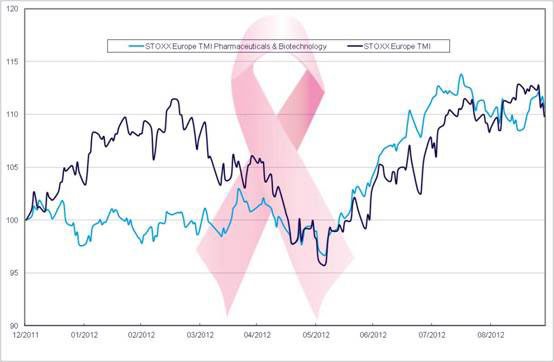
Index of the month: STOXX Europe Total Market Pharmaceuticals & Biotechnology Index
STOXX Europe TMI Pharmaceuticals & Biotechnology vs. STOXX Europe TMI:

As October is Breastcancer Awareness Month around the world, this month’s index of the month is the STOXX Europe Total Market Pharmaceuticals & Biotechnology Index. This index includes companies that are engaged in the research and development of biological substances for drug discovery and diagnostic development, and which derive the majority of their revenue from either the sale or licensing of these drugs and diagnostic tools. Furthermore, manufacturers of prescription or over-the-counter drugs and vaccine producers.
Since the beginning of 2012, the STOXX Europe Total Market Pharmaceuticals & Biotechnology Index was up10.58%, while the STOXX Europe Total Market Index was up 9.80% over the same timeframe.


