


- Domestic individual investors generated 24 percent of GPW Main Market equities turnover in H1 2021 (+2 pps YoY), a record-high H1 share in a decade. Foreign investors generated 55 percent of turnover (-3 pps YoY) and institutional investors generated 21 percent (+1 pps YoY).
- Individual investors remained in the lead on NewConnect as their share in turnover was 88 percent (-5 pps YoY). The share of institutional investors increased to 6 percent (+1 pps YoY) and the share of foreign investors also increased to 6 percent (+4 pps YoY).
- The share of individual investors in futures turnover decreased by 8 pps to 34 percent and the share of institutional investors decreased by 1 pps to 37 percent in H1 2021. The share of foreign investors increased by 9 pps to 29 percent, a historical record both for H1 and throughout a year in a decade.
GPW Main Market
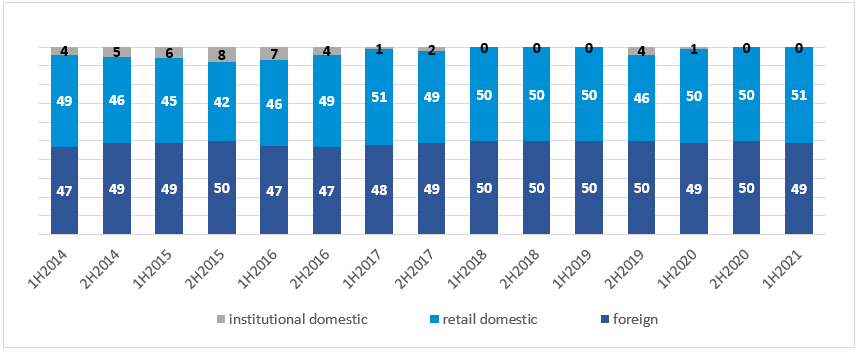
Foreign investors had the biggest share in GPW Main Market equities turnover in H1 2021. It stood at 55 percent, representing a decrease of 3 percentage points year on year. The share of domestic institutional investors in turnover stood at 24 percent, an increase of 2 percentage points year on year and a record-high H1 share in a decade. Domestic individual investors generated 21 percent of turnover, an increase of 1 percentage point year on year.
Fig. 1. Structure of investors on the Main Market in equities [%]
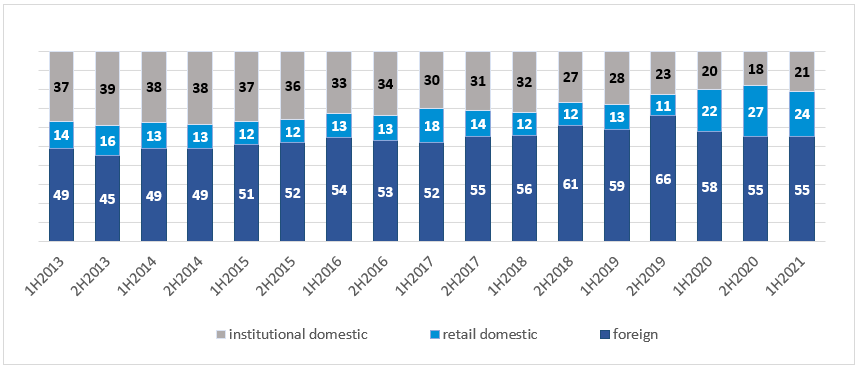
Source: GPW data based on broker’s orders of Exchange Members
NewConnect
Domestic individual investors are in the lead on New Connect. They generated 88 percent of turnover in H1 2021, a decrease of 5 percentage points year on year. Foreign investors generated 6 percent of turnover in H1 2021, an increase of 4 percentage points year on year. The share of institutions in turnover was 6 percent, an increase of 1 percentage point year on year.
Fig. 2. Structure of investors on NewConnect [%]
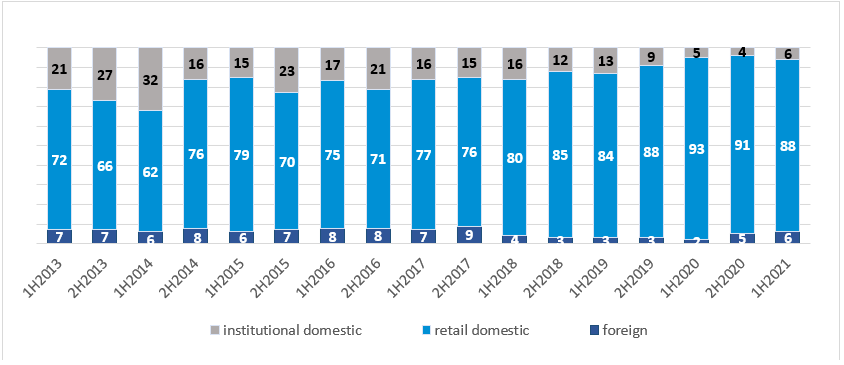
Source: GPW data based on broker’s orders of Exchange Members
Derivatives Market
Domestic individual investors generated 34 percent of futures turnover (-8 pps YoY) and 42 percent of options turnover (-7 pps YoY) in H1 2021. The share of foreign investors in futures turnover increased by 9 percentage points year on year to 29 percent, a historical record both in H1 and throughout the year in a decade. The share of foreign investors in options turnover also increased to 35 percent (+5 pps YoY), the highest H1 percentage in a decade. The share of institutional investors in futures turnover decreased to 37 percent in H1 2021 (-1 pps YoY) while their share in options turnover increased to 23 percent (+2 pps YoY). The share of foreign investors and individual investors in structured products turnover stood at 49 percent and 51 percent, respectively.
Fig. 3. Structure of investors on the futures market [%]
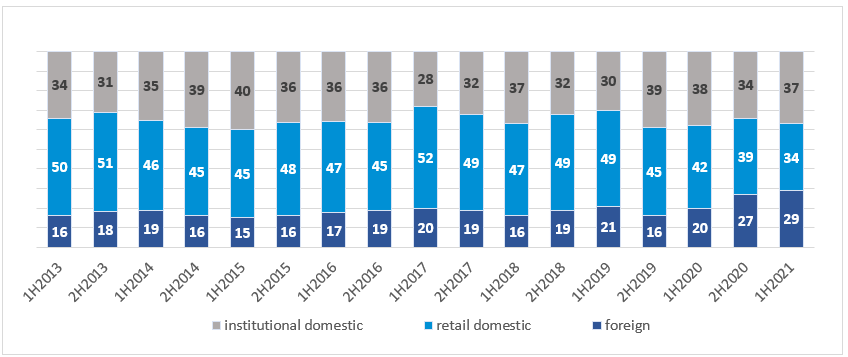
Source: GPW data based on broker’s orders of Exchange Members
Fig. 4. Structure of investors on the options market [%]
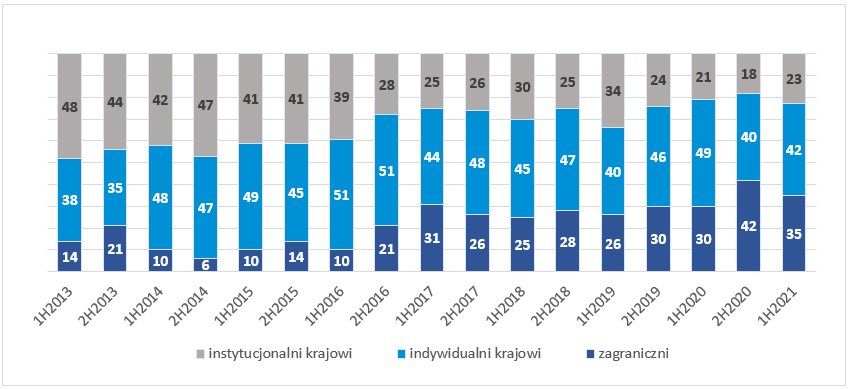
Source: GPW data based on broker’s orders of Exchange Members
Fig. 5. Structure of investors on the structured products market [%]
Source: GPW data based on broker’s orders of Exchange Members
Catalyst
The share of domestic individual investors in Catalyst bonds turnover decreased by 13 percentage points year on year to 26 percent in H1 2021. The share of foreign investors increased to 1 percent (+1 pps YoY) while the share of institutional investors increased by 12 pps YoY to 73 percent, a record of the last decade.
Fig. 6. Structure of investors on the bonds market [%]
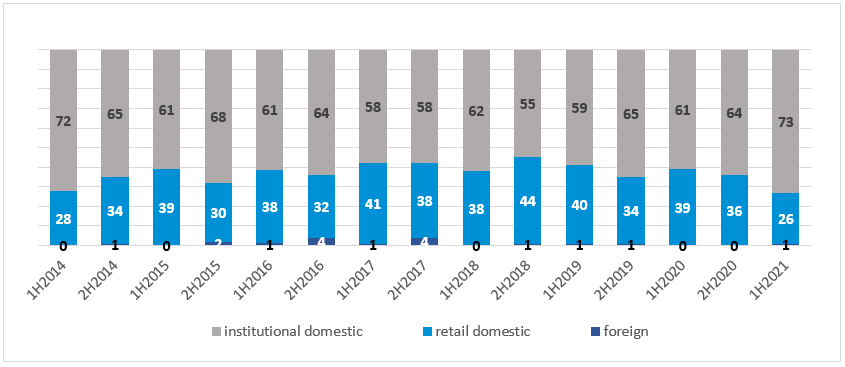
Source: GPW data based on broker’s orders of Exchange Members
The detailed results of the survey concerning the share of investors in financial instruments turnover are published on the GPW website: https://www.gpw.pl/analysis-investor-share-in-trading.
GPW has modified its methodology of sourcing data necessary to calculate the share of different groups of investors in turnover on the exchange. Such data are sourced from broker’s orders placed in the Exchange’s trading system. The number of online accounts is determined in a GPW survey covering domestic brokers. The number of active investment accounts is sourced from the Exchange’s trading system and represents the number of accounts for which at least one order was placed on GPW in the period under review.
***
History of the WSE
On 12 April 1991, the then Ministers of Ownership Transformation and Finance signed the Deed of Incorporation of the joint stock company "Giełda Papierów Wartościowych w Warszawie S.A." Four days later, on the day of the WSE's inaugural session, shares of five companies were traded and the turnover amounted to PLN 1990. Since 2018, the WSE has been classified as one of the 25 developed markets by the FTSE Russell agency. The history of the capital market on Polish soil dates back to the early 19th century. The first in Poland and one of the few in Europe, the Merchant Exchange, was established in Warsaw on 2 May 1817, soon became the largest market in Tsarist Russia, responsible for 5-6% of global securities trading. A thriving stock exchange, accounting for 90% of the domestic turnover, also operated in Warsaw in the interwar period. After the period of the People's Republic of Poland and the planned economy, it was not until 1989, with the political and economic transformation, that the Polish capital market was able to develop again.
Stock exchange today
The average EoB equity daily trading volume on the WSE was PLN 842.2 million in July 2021. The Main Market listed 429 companies (382 domestic and 47 foreign) and the NewConnect market listed 367 companies (363 domestic and 4 foreign) at the end of July 2021. Last year, the WSE Group generated record sales of PLN 403.8 million and one of the highest ever net profits of over PLN 151 million. According to the Federation of European Securities Exchanges, in 2020 the WSE ranked first in Europe in terms of percentage increase in equity turnover and third in terms of the value of initial offerings. At the end of 2020, the WSE was also the second market in Europe in terms of liquidity and achieved the status of world leader in terms of the number of listed companies in the gamedev sector.
WSE position in the region
The WSE is the leader among stock exchanges in Central and Eastern Europe by the number of listed companies and the total capitalisation of domestic companies. The WSE's share in trading on stock exchanges in the region is 81%. The WSE leads the initiative of the Three Seas Stock Exchanges and aspires to the role of a regional hub for young technological companies with huge potential, the so-called unicorns. Negotiations are currently underway for the WSE to acquire a majority stake in the Armenian Exchange.
***
The Warsaw Stock Exchange Group (GPW Group) operates trading platforms for shares, Treasury and corporate bonds, derivatives, electricity and gas, and provides indices and benchmarks including WIBOR and WIBID. The index agent FTSE Russell classifies the Polish capital market as a Developed Market since 2018. The markets operated by the GPW Group are the biggest in Central and Eastern Europe. For more information, visit www.gpw.pl
