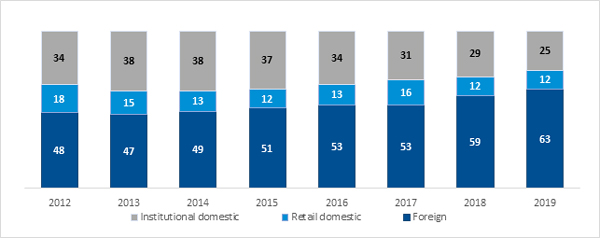
- Individual investors generated 12 percent of trade in equities on the GPW Main Market in 2019 (stable year on year). Foreign investors contributed 63 percent of trade (+4 pps. YoY) and institutional investors 25 percent (-4 pps. YoY).
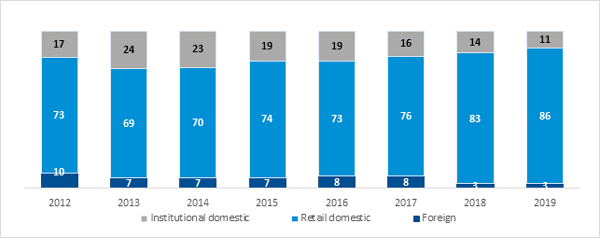
- On NewConnect, individual investors remained in the lead: their share in trade increased by 3 pps. to 86 percent. The share of institutional investors dropped to 11 percent (-3 pps. YoY). The share of foreign investors at 3 percent remained stable year on year.
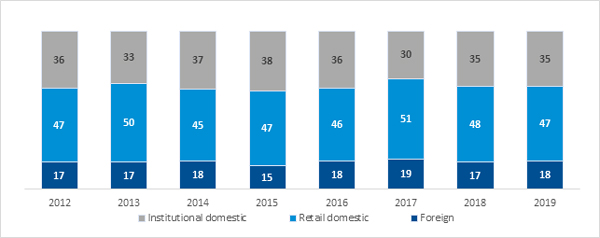
- Individual investors remained in the lead on the futures market in 2019 with a share of 47 percent of trade (-1 pps. YoY). The share of institutional investors remained stable at 35 percent and the share of foreign investors increased by 1 pps. year on year to 18 percent.
GPW Main Market
Foreign investors generated the biggest part of trade in equities on the GPW Main Market in 2019. They contributed 63 percent of trade, i.e., 4 percentage points more than in 2018. Foreign investors generated 66 percent of trade in H2 2019, i.e., 5 percentage points more than in H1 2019 and the biggest share of foreign investors in the last decade. Domestic individual investors contributed 23 percent of trade in H2 2019, a decrease of 3 percentage points compared to H1 2019 and a decrease of 6 percentage points compared to all of 2018. Individual investors generated 11 percent of trade in equities on the GPW Main Market in H2 2019, a decrease of 1 percentage point year on year.
Market makers (with a share of 37 percent) were the leading group of institutional investors in H2 2019, followed by investment funds (27 percent) and pension funds (13 percent).
Table 1. Structure of investors on the Main Market in shares [%]
Source: GPW survey of investment firms, estimates
NewConnect
On NewConnect, individual investors generated the biggest part of trade at 86 percent, up by 3 percentage points compared to 2018. The share of foreign investors in trade was 3 percent (the same as in 2018) and the share of institutional investors was 11 percent (down by 3 percentage points year on year). Investment funds were the leading group of domestic institutions, accounting for 52 percent of trade in equities in H2 2019 (up by 5 percentage points year on year).
Table 2. Structure of investors on NewConnect [%]
Source: GPW survey of investment firms, estimates
Derivatives market
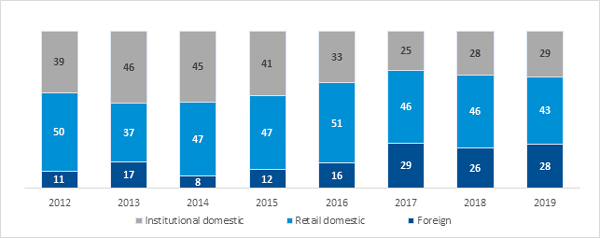
Domestic individual investors were in the lead on the derivatives market in 2019. Their share in the volume of trade in futures was 47 percent and their share in trade in options was 43 percent in 2019. The share of foreign investors in futures trade increased by 1 percentage point to 18 percent while their share in options trade increased by 2 percentage points to 28 percent. The share of institutional investors in trade in futures remained stable year on year at 35 percent and their share in trade in options increased by 1 percentage point to 29 percent of the total volume of trade. Market makers accounted for 54 percent of trade in futures and 42 percent of trade in options among all domestic institutions in H2 2019. The share of foreign investors and that of individual investors on the structured products market was 50 percent and 48 percent, respectively.
Table 3. Structure of investors on the futures market [%]
Source: GPW survey of investment firms, estimates
Table 4. Structure of investors on the option market [%]
Source: GPW survey of investment firms, estimates
Table 5. Structure of investors on the structured product market [%]
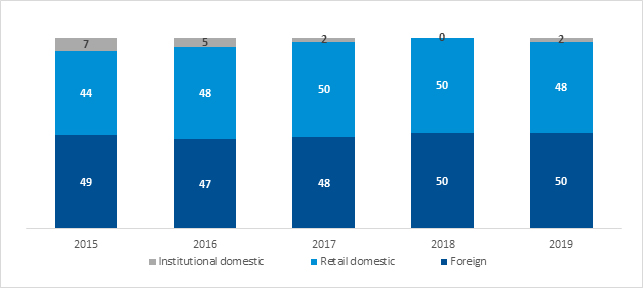
Source: GPW survey of investment firms, estimates
Catalyst
Trade in bonds on Catalyst is dominated by domestic institutions (62 percent in 2019 vs. 59 percent in 2018). Individual investors generated 37 percent of trade in 2019, a decrease of 4 percentage points year on year.
Table 6. Structure of investors on the bond market [%]
.jpg)
Source: GPW survey of investment firms, estimates
The detailed results of the survey concerning the share of investors in trade in financial instruments are published on the GPW website https://www.gpw.pl/analizy.
GPW conducted a survey of the share of different investor groups (foreign investors, domestic institutional investors, domestic individual investors) in trade in financial instruments on the market in 2019. According to the applied methodology, the share of each investor group is based on the results of a survey of domestic brokerage houses, as well as turnover data of remote exchange members. The activity of market makers and management of clients’ portfolios were included in the category of domestic institutional investors. The survey covered trade on the GPW electronic order book. Annual figures are based on semi-annual numbers.
***
***
The Warsaw Stock Exchange Group (GPW Group) operates trading platforms for shares, Treasury and corporate bonds, derivatives, electricity and gas, and provides indices and benchmarks including WIBOR and WIBID. The index agent FTSE Russell classifies the Polish capital market as a Developed Market since 2018. The markets operated by the GPW Group are the biggest in Central and Eastern Europe. For more information, visit www.gpw.pl


