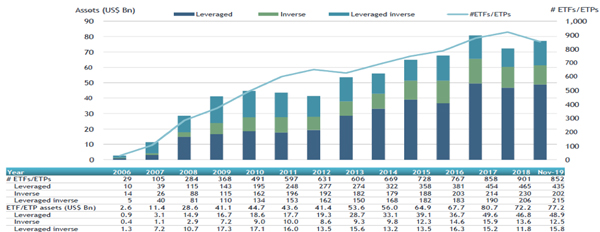
ETFGI, a leading independent research and consultancy firm covering trends in the global ETFs/ETPs ecosystem, reported today that Leveraged and Inverse ETFs and ETPs suffered net outflows of US$138 million during November. Total assets invested in leveraged and inverse ETFs and ETPs decreased from US$77.5 billion at the end of October to $77.2 billion, according to ETFGI’s November 2019 Leveraged and Inverse ETFs and ETPs industry landscape insights report, an annual paid-for research subscription service. (All dollar values in USD unless otherwise noted.)
Highlights
- Assets invested in leveraged and inverse ETFs/ETPs decreased by 0.4% during November 2019 to $77.2 billion.
- During November, leveraged and inverse ETFs/ETPs listed globally saw net outflows of $138 million.
- The majority of assets were invested in Leverage ETFs/ETPs with $48.9 billion, followed by Leveraged/Inverse products with assets of $15.8 billion, then Inverse with $12.5 billion.
“During November the S&P 500 gained 3.6% as global markets were resistant to fears of inflation and showed optimism on the trade talks. Global equities as measured by the S&P Global BMI were up 2.5% and the S&P Emerging BMI gained 0.1%.” According to Deborah Fuhr, managing partner, founder and owner of ETFGI.
At the end of November 2019, the Global leveraged/inverse ETF/ETP industry had 852 ETFs/ETPs. Of these 852 ETFs/ETPs, 435 were leveraged products, while 202 were inverse listings, and 215 were leveraged inverse. The largest market for leveraged and inverse ETFs/ETPs was in the United States, which, at the end of November 2019, had assets of $48.1 billion invested in 281 ETFs/ETPs.
Global leveraged/inverse ETF and ETP asset growth as at the of end of November 2019

During November, globally listed leveraged and inverse ETFs/ETPs suffered net outflows of $138 million and net outflows year-to-date reached $2.90 billion. The top 20 leveraged and inverse ETFs/ETPs by Year-to-Date net new assets collectively gathered $15.91 billion year-to-date to November. TheNEXT FUNDS Nikkei 225 Double Inverse Index Exchange Traded Fund (1357 JP) gathered $2.43 billion alone, the largest net inflow year-to-date to November.
Top 20 ETFs/ETPs by YTD net new assets November 2019: Leveraged and Inverse
|
Name |
Country Listed |
Ticker |
Assets (US$ Mn) |
ADV (US$ Mn) Nov-19 |
NNA |
Leverage |
|
NEXT FUNDS Nikkei 225 Double Inverse Index Exchange Traded Fund |
Japan |
1357 JP |
2,428.47 |
160.21 |
2,209.10 |
Leveraged Inverse |
|
VelocityShares Daily 2x VIX Short Term ETN |
US |
TVIX US |
891.77 |
240.93 |
2,004.69 |
Leveraged |
|
ProShares UltraPro Short QQQ |
US |
SQQQ US |
1,222.63 |
264.20 |
1,493.33 |
Leveraged Inverse |
|
VelocityShares Daily 3x Long Natural Gas ETN |
US |
UGAZ US |
923.70 |
419.32 |
1,316.83 |
Leveraged |
|
iPath Series B S&P 500 VIX Short-Term Futures ETN |
US |
VXX US |
928.17 |
475.93 |
1,264.57 |
Leveraged |
|
ProShares Ultra VIX Short-Term Futures |
US |
UVXY US |
579.45 |
205.19 |
1,001.86 |
Leveraged |
|
ProShares UltraShort S&P500 |
US |
SDS US |
1,080.97 |
117.92 |
654.13 |
Leveraged Inverse |
|
Daiwa ETF Japan Nikkei225 Inverse Index |
Japan |
1456 JP |
595.00 |
0.14 |
642.92 |
Inverse |
|
ProShares UltraPro Short S&P 500 |
US |
SPXU US |
612.36 |
98.98 |
551.27 |
Leveraged Inverse |
|
ProShares Short S&P500 |
US |
SH US |
1,930.97 |
79.48 |
494.66 |
Inverse |
|
Direxion Daily S&P 500 Bear 3X Shares |
US |
SPXS US |
501.04 |
84.56 |
480.22 |
Leveraged Inverse |
|
CSOP Hang Seng Index Daily -2x Inverse Product |
Hong Kong |
7500 HK |
484.25 |
56.04 |
468.70 |
Leveraged Inverse |
|
Samsung KODEX 200 Futures Inverse 2X ETF |
South Korea |
252670 KS |
674.13 |
117.05 |
408.90 |
Leveraged Inverse |
|
Direxion Daily Semiconductors Bear 3x Shares |
US |
SOXS US |
239.21 |
81.96 |
385.92 |
Leveraged Inverse |
|
Direxion Daily Gold Miners Bear 3x Shares |
US |
DUST US |
339.89 |
91.10 |
382.79 |
Leveraged Inverse |
|
Lyxor UCITS ETF CAC 40 DAILY DOUBLE SHORT |
France |
BX4 FP |
328.98 |
23.32 |
325.37 |
Leveraged Inverse |
|
Xtrackers ShortDAX Daily UCITS ETF - 1C |
Germany |
XSDX GY |
579.17 |
5.97 |
303.26 |
Inverse |
|
Simplex - Nikkei Average Bear Double Exchange Trade Fund |
Japan |
1360 JP |
381.23 |
21.43 |
292.81 |
Leveraged Inverse |
|
NEXT NOTES Nikkei TOCOM Leveraged Crude Oil ETN |
Japan |
2038 JP |
304.62 |
3.49 |
260.40 |
Leveraged |
|
ProShares UltraShort QQQ |
US |
QID US |
323.06 |
46.52 |
249.97 |
Leveraged Inverse |


