


ETFGI, a leading independent research and consultancy firm covering trends in the global ETF/ETP ecosystem, reported today that ETFs and ETPs listed in US suffered net outflows of US$3.36 billion in August, bringing year-to-date net inflows to US$146.41 billion. Assets invested in the US ETF/ETP industry have decreased by 1.6%, from US$4.02 trillion at the end of July, to US$3.96 trillion, according to ETFGI's August 2019 US ETF and ETP industry landscape insights report, an annual paid-for research subscription service. (All dollar values in USD unless otherwise noted.)
Highlights
- Assets invested in the US ETF/ETP industry stood at $3.96 Trillion.
- Asset invested in the US ETF/ETP industry decreased 1.6% in August.
- August 2019, ETFs/ETPs listed in US suffered $3.36 Bn in net outflows.
“The S&P 500® slid 1.6% during August, which can be partially attributed to both the growing tensions stemming from the US/China trade talks, or lack thereof, and the sentiment placed on the inverted US yield curve. From an International standpoint, the S&P Developed Ex-U.S. BMI declined 2.5%, with the biggest decline coming out of Hong Kong (-8.0%), driven by recent protests. The S&P Emerging BMI fell 4.5% during the month, with only one riser, Egypt, up 10.5%.” According to Deborah Fuhr, managing partner, founder and owner of ETFGI.
Growth in US ETF and ETP assets as of the end of August 2019
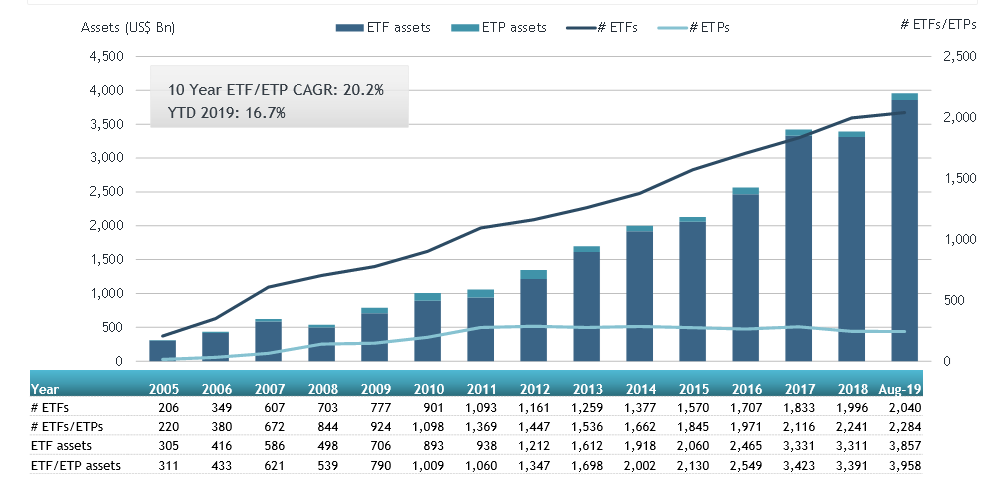

At the end of August 2019, the US ETF/ETP industry had 2,284 ETFs/ETPs, from 150 providers listed on 3 exchanges.
In August 2019, ETFs/ETPs suffered net outflows of $3.36 Bn. Equity ETFs/ETPs listed in US suffered the largest net outflows of $22.23 Bn in August, bringing YTD net inflows for 2019 to $42.69 Bn, considerably less than the $109.44 Bn in net inflows Equity products had attracted for the corresponding period to August 2018. Fixed Income ETFs/ETPs listed in US attracted net inflows of $10.86 Bn in August, bringing YTD net inflows for 2019 to $83.96 Bn, substantially more than the $51.50 Bn in net inflows for the corresponding period to August 2018. Commodity ETFs/ETPs gathered $4.07 Bn, bringing the YTD net inflows to $6.56 Bn for 2019, which is significantly greater than the $3.55 Mn in net outflows for the corresponding period to August 2018.
Substantial inflows can be attributed to the top 20 ETF's by net new assets, which collectively gathered $22.86 Bn in August, the iShares Core S&P 500 ETF gathered $2.52 Bn alone.
Top 20 ETFs by net new assets August 2019: US
|
Name |
Ticker |
Assets |
NNA |
NNA |
|
iShares Core S&P 500 ETF |
IVV US |
179912.35 |
7,392.51 |
2515.30 |
|
iShares MSCI USA Minimum Volatility ETF |
USMV US |
33374.93 |
9,576.11 |
2185.55 |
|
Vanguard S&P 500 ETF |
VOO US |
119178.51 |
13,741.30 |
2007.66 |
|
iShares 7-10 Year Treasury Bond ETF |
IEF US |
18826.02 |
7,307.91 |
1665.53 |
|
iShares US Treasury Bond ETF |
GOVT US |
14124.61 |
6,416.41 |
1523.22 |
|
Vanguard Total Bond Market ETF |
BND US |
44980.53 |
5,643.73 |
1493.81 |
|
Consumer Staples Select Sector SPDR Fund |
XLP US |
13821.94 |
2,288.46 |
1329.46 |
|
iShares 1-3 Year Treasury Bond ETF |
SHY US |
17996.58 |
(3,252.72) |
1113.90 |
|
Schwab US TIPS ETF |
SCHP US |
8125.97 |
1,849.17 |
1021.56 |
|
iShares Core S&P Total U.S. Stock Market ETF |
ITOT US |
22117.64 |
4,257.11 |
911.63 |
|
Vanguard Total Stock Market ETF |
VTI US |
116896.30 |
7,142.55 |
884.63 |
|
iShares Broad USD High Yield Corporate Bond ETF |
USHY US |
2272.37 |
1,871.50 |
825.22 |
|
PIMCO Enhanced Short Maturity Strategy Fund |
MINT US |
12661.80 |
372.86 |
804.35 |
|
Vanguard Total International Bond ETF |
BNDX US |
20390.38 |
5,746.60 |
787.37 |
|
iShares 20+ Year Treasury Bond ETF |
TLT US |
17028.39 |
5,492.93 |
783.21 |
|
JPMorgan Ultra-Short Income ETF |
JPST US |
8377.03 |
3,211.34 |
736.31 |
|
SPDR Portfolio Aggregate Bond ETF |
SPAB US |
4907.58 |
1,019.87 |
595.62 |
|
Vanguard Total International Stock Index Fund ETF |
VXUS US |
14100.16 |
3,297.60 |
587.85 |
|
Schwab US Large-Cap ETF |
SCHX US |
17785.96 |
1,862.79 |
549.20 |
|
Vanguard Short-Term Inflation-Protected Securities Index Fund |
VTIP US |
6837.22 |
829.87 |
540.74 |
The top 10 ETP's by net new assets collectively gathered $4.39 Bn in August. The SPDR Gold Shares gathered $2.66 Bn alone.
Top 10 ETPs by net new assets August 2019:US
|
Name |
Ticker |
Assets |
NNA |
NNA |
|
SPDR Gold Shares |
GLD US |
43146.20 |
4,438.10 |
2663.07 |
|
iShares Gold Trust |
IAU US |
16029.11 |
2,162.02 |
896.76 |
|
iShares Silver Trust |
SLV US |
7133.62 |
1,171.92 |
542.17 |
|
Aberdeen Physical Swiss Gold Shares |
SGOL US |
1104.30 |
93.48 |
65.40 |
|
Large Cap Growth Index-Linked Exchange Traded Notes due 2028 |
FRLG US |
1077.92 |
475.68 |
58.12 |
|
Invesco DB US Dollar Index Bullish Fund |
UUP US |
349.63 |
(163.08) |
42.40 |
|
United States Natural Gas Fund LP |
UNG US |
322.51 |
67.60 |
38.43 |
|
VelocityShares 3x Inverse Crude Oil ETN |
DWT US |
173.45 |
143.49 |
36.43 |
|
FI Enhanced Global High Yield ETN |
FIHD US |
2005.45 |
313.14 |
23.75 |
|
ETRACS Monthly Pay 2xLeveraged Mortgage REIT ETN Series B |
MRRL US |
169.51 |
138.03 |
23.55 |
Investors have tended to invest in Various Fixed Income US Exposure and Gold ETFs and ETPs.
