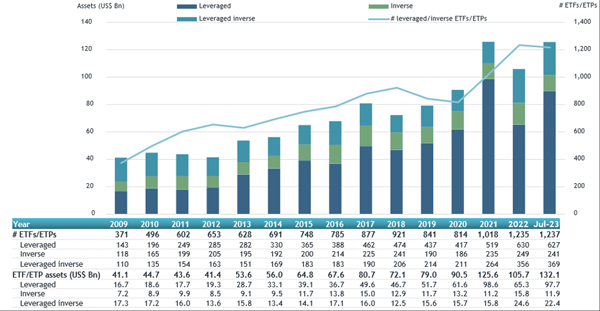
ETFGI, a leading independent research and consultancy firm covering trends in the global ETFs ecosystem, reported today that assets invested in Leveraged and Inverse ETFs listed globally reached a record US$132 billion at the end of July. Assets invested in Leveraged and Inverse ETFs listed globally have increased 24.5% year-to-date as of the end of July. During July, leveraged and Inverse ETFs listed globally suffered net outflows of US$1.30 Bn, bringing year-to-date net inflows to US$5.54 billion, according to ETFGI’s July 2023 Leveraged and Inverse ETF and ETP industry landscape insights report, an annual paid-for research subscription service. (All dollar values in USD unless otherwise noted.)
Highlights
- Assets invested in Leveraged and Inverse ETFs and ETPs reached a record of $132 Bn at the end of July beating the previous record of $126 Bn at the end of December 2021.
- Assets have increased 24.5% during year-to-date in 2023, going from $106 Bn at end of 2022 to $132 Bn.
- Net outflows of $1.30 Bn in July 2023.
- Year-to-date net inflows during 2023 of $5.54 Bn are the fifth highest on record while the highest recorded year-to-date net inflows were of $23.64 Bn in 2022, followed by YTD net inflows of $20.88 Bn in 2020.
“The S&P 500 increased by 3.21% in July and is up 20.65% year-to-date in 2023. Developed markets excluding the US increased by 3.62% in July and are up 15.09% YTD in 2023. Norway (up 8.97%) and Israel (up 8.06%) saw the largest increases amongst the developed markets in July. Emerging markets increased by 6.15% during July and are up 11.08% YTD in 2023. Turkey (up 20.52%) and Pakistan (up 15.89%) saw the largest increases amongst emerging markets in July.” According to Deborah Fuhr, managing partner, founder, and owner of ETFGI.
Leveraged and inverse ETFs listed globally asset growth as of the end of July

At the end of July there were 1,237 leverage and inverse ETFs/ETPs listed globally with assets of $132 billion listed on 30 exchanges in 24 countries. During July, leveraged and inverse ETFs listed globally suffered net outflows of $1.30 Bn. The largest market for leveraged and inverse ETFs/ETPs was in the United States, which, at the end of July, had assets of $93 Bn invested in 238 ETFs/ETPs.
The top 20 leveraged and inverse ETFs/ETPs by Year-to-Date net new assets collectively gathered $18.38 Bn during 2023. ProShares UltraPro Short QQQ (SQQQ US) gathered $4.91 Bn, the largest individual year-to-date net inflow.
Top 20 ETFs/ETPs by YTD net new assets July 2023: Leveraged and Inverse
|
Name |
Country Listed |
Ticker |
Assets |
NNA |
Leverage |
|
ProShares UltraPro Short QQQ |
US |
SQQQ US |
3,909.51 |
4,907.57 |
Leveraged Inverse |
|
Direxion Daily 20 Year Plus Treasury Bull 3x Shares |
US |
TMF US |
2,480.99 |
1,965.66 |
Leveraged |
|
ProShares Ultra DJ-UBS Natural Gas |
US |
BOIL US |
1,085.55 |
1,698.67 |
Leveraged |
|
Direxion Daily Semiconductors Bear 3x Shares |
US |
SOXS US |
1,045.62 |
1,694.72 |
Leveraged Inverse |
|
NEXT FUNDS Nikkei 225 Double Inverse Index Exchange Traded Fund - Acc |
Japan |
1357 JP |
1,528.72 |
1,446.98 |
Leveraged Inverse |
|
ProShares Ultra S&P500 |
US |
SSO US |
4,678.43 |
908.74 |
Leveraged |
|
Samsung Kodex KOSDAQ150 Inverse ETF - Acc |
South Korea |
251340 KS |
919.48 |
873.92 |
Inverse |
|
ProShares Ultra QQQ |
US |
QLD US |
5,497.35 |
552.44 |
Leveraged |
|
Direxion Daily TSLA Bull 1.5X Shares |
US |
TSLL US |
1,071.25 |
450.14 |
Leveraged |
|
Direxion Daily Regional Banks Bull 3X Shares |
US |
DPST US |
711.46 |
423.74 |
Leveraged |
|
Simplex - Nikkei Average Bear Double Exchange Trade Fund - Acc |
Japan |
1360 JP |
406.77 |
410.85 |
Leveraged Inverse |
|
ProShares Ultra VIX Short-Term Futures |
US |
UVXY US |
324.58 |
399.70 |
Leveraged |
|
Rakuten ETF-Nikkei 225 Double Inverse Index - Acc |
Japan |
1459 JP |
356.77 |
387.92 |
Leveraged Inverse |
|
ProShares UltraPro Short S&P 500 |
US |
SPXU US |
980.32 |
381.69 |
Leveraged Inverse |
|
Yuanta Daily US Treasury 20+ Year Bond Bull 2X ETF - Acc |
Taiwan |
00680L TT |
378.22 |
371.66 |
Leveraged |
|
iPath Series B S&P 500 VIX Short-Term Futures ETN |
US |
VXX US |
403.65 |
366.58 |
Leveraged |
|
MicroSectors FANG+ Index -3X Inverse Leveraged ETNs due January 8, 2038 |
US |
FNGD US |
196.61 |
323.09 |
Leveraged Inverse |
|
ProShares UltraShort QQQ |
US |
QID US |
410.98 |
284.05 |
Leveraged Inverse |
|
Direxion Daily FTSE China Bull 3x Shares |
US |
YINN US |
833.73 |
271.02 |
Leveraged |
|
Direxion Daily Small Cap Bear 3x Shares |
US |
TZA US |
493.52 |
262.21 |
Leveraged Inverse |


