


ETFGI, a leading independent research and consultancy firm covering trends in the global ETF/ETP ecosystem, reported today that ETFs and ETPs listed Globally gathered net inflows of US$3.43 billion in August, bringing year-to-date net inflows to US$273.04 billion. Assets invested in the Global ETF/ETP industry have decreased by 1.6%, from US$5.74 trillion at the end of July, to US$5.65 trillion at the end of August, according to ETFGI's August 2019 Global ETF and ETP industry landscape insights report, an annual paid-for research subscription service. (All dollar values in USD unless otherwise noted.)
Highlights
- Assets invested in the Global ETF/ETP industry stood at $5.65 trillion at the end of August.
- Asset invested in the Global ETF/ETP industry decreased by 1.6% in August.
- August 2019, ETFs/ETPs listed Globally gathered $3.43 Bn in net inflows.
“The S&P 500® slid 1.6% during August, which can be partially attributed to both the growing tensions stemming from the US/China trade talks, or lack thereof, and the sentiment placed on the inverted US yield curve. From an International standpoint, the S&P Developed Ex-U.S. BMI declined 2.5%, with the biggest decline coming out of Hong Kong (-8.0%), driven by recent protests. The S&P Emerging BMI fell 4.5% during the month, with only one riser, Egypt, up 10.5%.” According to Deborah Fuhr, managing partner, founder and owner of ETFGI.
Global ETF and ETP assets as of the end of August 2019
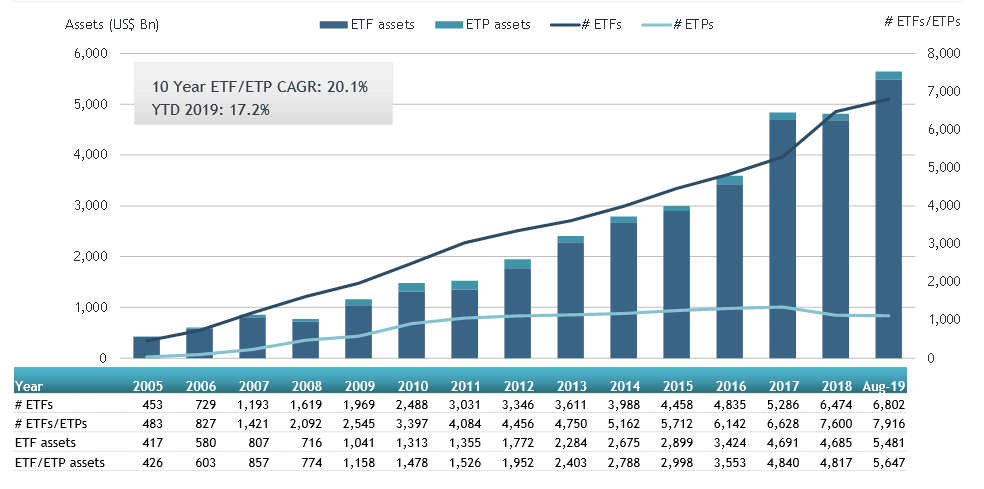

At the end of August 2019, the Global ETF/ETP industry had 7,916 ETFs/ETPs, with 15,936 listings, assets of $5.65 Tn, from 423 providers listed on 72 exchanges in 58 countries.
In August 2019, ETFs/ETPs gathered net inflows of $3.43 Bn. Fixed income ETFs/ETPs listed Globally attracted net inflows of $16.40 Bn in August, bringing net inflows for 2019 to $148.13 Bn, considerably greater than the $66.94 Bn in net inflows fixed income products had attracted by the end of August 2018. Equity ETFs/ETPs listed Globally suffered net outflows of $25.49 Bn in August, bringing net inflows for 2019 to $89.04 Bn, substantially less than the $205.89 Bn in net inflows equity products had attracted by the end of August 2018. Commodity ETFs/ETPs gathered $6.52 Bn in net inflows bringing net inflows to $14.29 Bn for 2019, which is greater than the $1.42 Bn in net outflows gathered through August 2018.
Substantial inflows can be attributed to the top 20 ETF's by net new assets, which collectively gathered $25.85 Bn in August, the SPDR S&P 500 ETF Trust (SPY US) gathered $2.52 Bn alone.
Top 20 ETFs by net new inflows August 2019: Global
|
Name |
Ticker |
Assets |
NNA |
NNA |
|
iShares Core S&P 500 ETF |
IVV US |
179912.35 |
7,392.51 |
2515.30 |
|
iShares MSCI USA Minimum Volatility ETF |
USMV US |
33374.93 |
9,576.11 |
2185.55 |
|
Vanguard S&P 500 ETF |
VOO US |
119178.51 |
13,741.30 |
2007.66 |
|
iShares 7-10 Year Treasury Bond ETF |
IEF US |
18826.02 |
7,307.91 |
1665.53 |
|
TOPIX Exchange Traded Fund |
1306 JP |
85597.00 |
12,031.18 |
1578.76 |
|
iShares US Treasury Bond ETF |
GOVT US |
14124.61 |
6,416.41 |
1523.22 |
|
Vanguard Total Bond Market ETF |
BND US |
44980.53 |
5,643.73 |
1493.81 |
|
NEXT FUNDS Nikkei 225 Leveraged Index ETF |
1570 JP |
4310.26 |
(1,796.84) |
1467.64 |
|
Consumer Staples Select Sector SPDR Fund |
XLP US |
13821.94 |
2,288.46 |
1329.46 |
|
iShares 1-3 Year Treasury Bond ETF |
SHY US |
17996.58 |
(3,252.72) |
1113.90 |
|
BMO S&P 500 Index ETF (US Dollar Units) |
ZSP/U CN |
1392.96 |
910.35 |
1080.81 |
|
Schwab US TIPS ETF |
SCHP US |
8125.97 |
1,849.17 |
1021.56 |
|
Listed Index Fund TOPIX |
1308 JP |
38928.75 |
6,123.26 |
943.91 |
|
iShares Core S&P Total U.S. Stock Market ETF |
ITOT US |
22117.64 |
4,257.11 |
911.63 |
|
Daiwa ETF TOPIX |
1305 JP |
40633.20 |
5,338.66 |
885.52 |
|
Vanguard Total Stock Market ETF |
VTI US |
116896.30 |
7,142.55 |
884.63 |
|
iShares Broad USD High Yield Corporate Bond ETF |
USHY US |
2272.37 |
1,871.50 |
825.22 |
|
Fullgoal CSI Military Industry Leading Enterprises ETF |
512710 CH |
857.22 |
821.74 |
821.74 |
|
PIMCO Enhanced Short Maturity Strategy Fund |
MINT US |
12661.80 |
372.86 |
804.35 |
|
Vanguard Total International Bond ETF |
BNDX US |
20390.38 |
5,746.60 |
787.37 |
The top 10 ETP's by net new assets collectively gathered $5.94 Bn in August. The SPDR Gold Shares gathered $2.66 Bn alone.
Top 10 ETPs by net new inflows August 2019: Global
|
Name |
Ticker |
Assets |
NNA |
NNA |
|
SPDR Gold Shares |
GLD US |
43146.20 |
4,438.10 |
2663.07 |
|
iShares Gold Trust |
IAU US |
16029.11 |
2,162.02 |
896.76 |
|
iShares Silver Trust |
SLV US |
7133.62 |
1,171.92 |
542.17 |
|
iShares Physical Gold ETC |
SGLN LN |
6711.78 |
1,424.67 |
440.96 |
|
Invesco Gold ETC |
SGLD LN |
7252.10 |
1,195.71 |
434.01 |
|
NEXT NOTES Nikkei TOCOM Leveraged Crude Oil ETN |
2038 JP |
260.40 |
260.40 |
260.40 |
|
NEXT NOTES S&P500 Dividend Aristocrats Net Return ETN |
2044 JP |
250.65 |
250.65 |
250.65 |
|
Xtrackers Physical Gold ETC (EUR) |
XAD5 GY |
3429.00 |
394.66 |
196.64 |
|
INVESTEC BNK LMT VAR RT ETN |
IBLVR1 SJ |
151.12 |
151.12 |
151.12 |
|
NEXT NOTES Tokyo Stock Exchange Mothers Index ETN |
2042 JP |
102.17 |
102.17 |
102.17 |
ETFs/ETPs providing exposure to Gold, US Equities, and a variety of Fixed Income exposure were most popular during August.

