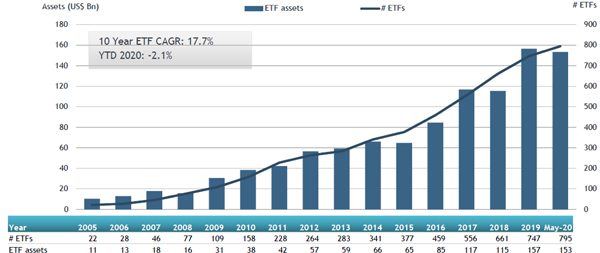
ETFGI, a leading independent research and consultancy firm covering trends in the global ETFs/ETPs ecosystem, reported today that ETFs listed in Canada gathered net inflows of US$1.87 billion during May, bringing year-to-date net inflows to US$14.44 billion which is nearly double the US$7.62 billion gathered at this point in 2019. During the month ETF assets increased by 4.7%, from US$146.39 billion to US$153.29 billion according to ETFGI's May 2020 Canadian ETFs and ETPs industry landscape insights report, an annual paid-for research subscription service. (All dollar values in USD unless otherwise noted.)
Highlights
- Assets of $153.29 billion at the end of May are the 4thhighest on record.
- YTD net inflows of $14.44 billion are nearly double the $7.62 billion gathered
at this point in 2019. - Equity ETFs listed in Canada were extremely attractive during May with net inflows of $1.38 billion.
- The Investment Industry Regulatory Organization of Canada (IIROC) released its proposal, "Improving Self-Regulation for Canadians", outlining the benefits of bringing together IIROC and the Mutual Fund Dealers Association of Canada (MFDA) as divisions of a consolidated self-regulatory organization (SRO). Benefits would include enhanced investor protection and access to advice, and a significant reduction in overlapping regulatory burden and red tape.
“The S&P 500 gained 4.8% in May and remains only 5.0% down from its level at the beginning of the year, as markets anticipated relief from a COVID-19-driven economic slowdown. Developed markets outside the U.S. were also up 4.8% for the month with Sweden (up 9.9%) and Germany (up 9.2%) the top performers, while Hong Kong (down 7.7%), was the only market to be down for the month due to recent political turmoil. Emerging markets lagged during the month, gaining 1.3% as the economic impact of virus shutdowns remains somewhat more uncertain compared to developed regions.” According to Deborah Fuhr, managing partner, founder and owner of ETFGI.
Growth in Canadian ETF and ETP assets as of the end of May 2020

At the end of May 2020, the Canadian ETFs industry had 795 ETFs, with 968 listings, from 39 providers on listed on 2 exchanges. Overall ETFs gathered net inflows of $1.87 Bn during May. Equity ETFs gathered net inflows of $1.38 Bn in May, bringing YTD net inflows in 2020 to $8.38 Bn, higher than the $2.47 Bn in net inflows Equity products had attracted at this point in 2019. Fixed Income ETFs gathered net inflows of $173 Mn during May, bringing net inflows for the year to May 2020 to $1.45 Bn, slightly lower than the $1.78 Bn in net inflows Fixed Income products had attracted at this point in 2019. Commodity ETFs accumulated net inflows of $79 Mn in May, and YTD net inflows of $285 Mn, which is much greater than the net outflows of $4 Mn over the same period last year.
Active ETFs attracted net inflows of $156 Mn during the month, gathering net inflows for the year in Canada of $4.04 billion, greater than the $3.25 billion in net inflows Active products had reported for the year to May 2019.
Substantial inflows can be attributed to the top 20 ETFs by net new assets, which collectively gathered $2.11 billion during May, TD International Equity Index ETF (TPE CN) gathered $507.27 million alone.
Top 20 ETFs by net new assets May 2020: Canada
|
Name |
Ticker |
Assets |
NNA |
NNA |
|
TPE CN |
554.90 |
521.11 |
507.27 |
|
|
BMO S&P 500 Index ETF |
ZSP CN |
5,917.75 |
692.24 |
209.62 |
|
iShares Core Canadian Universe Bond Index ETF |
XBB CN |
3,224.20 |
245.93 |
176.48 |
|
Horizons Cdn Select Universe Bond ETF |
HBB CN |
1,240.62 |
909.41 |
174.71 |
|
Purpose High Interest Savings ETF |
PSA CN |
1,779.82 |
69.16 |
173.00 |
|
CI First Asset Morningstar International Momentum Index ETF (unhedged) |
ZXM/B CN |
134.05 |
110.18 |
111.53 |
|
Mackenzie Canadian All Corporate Bond Index ETF |
QCB CN |
119.58 |
109.37 |
88.88 |
|
BMO Long Federal Bond Index ETF |
ZFL CN |
1,288.17 |
14.44 |
87.44 |
|
Horizons Cash Maximizer ETF - Acc |
HSAV CN |
242.17 |
244.37 |
78.58 |
|
iShares S&P/TSX Global Gold Index ETF |
XGD CN |
934.63 |
156.27 |
68.37 |
|
iShares Core Canadian Short Term Bond Index ETF |
XSB CN |
1,697.83 |
21.70 |
56.44 |
|
Fidelity Global Core Plus Bond ETF |
FCGB CN |
399.54 |
235.95 |
53.09 |
|
BMO MSCI Europe High Quality Hedged to CAD Index ETF |
ZEQ CN |
215.29 |
48.82 |
43.57 |
|
iShares Core S&P/TSX Capped Composite Index ETF |
XIC CN |
4,415.28 |
299.43 |
43.55 |
|
iShares Edge MSCI Min Vol Global Index ETF |
XMW CN |
241.59 |
55.85 |
42.36 |
|
iShares Gold Bullion Fund - CAD Hdg |
CGL CN |
518.18 |
161.32 |
41.00 |
|
iShares NASDAQ 100 Index Fund (CAD-Hedged) |
XQQ CN |
631.16 |
175.38 |
40.79 |
|
BMO Mid-Term US IG Corporate Bond Index ETF |
ZIC CN |
1,173.78 |
51.74 |
40.11 |
|
iShares S&P/TSX 60 Index Fund |
XIU CN |
6,006.06 |
195.10 |
39.97 |
|
Fidelity International High Quality Index ETF |
FCIQ CN |
85.61 |
51.06 |
36.19 |

Investors have tended to invest in Equity ETFs during May.


