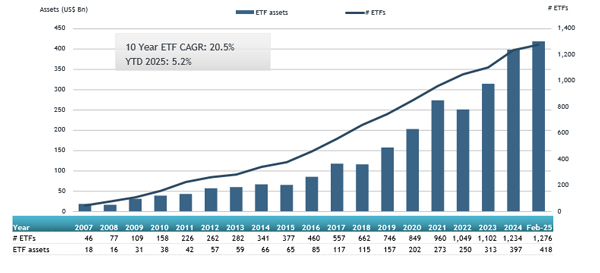
ETFGI, a leading independent research and consultancy firm renowned for its expertise in subscription research, consulting services, events, and ETF TV on global ETF industry trends, reported today that assets invested in the ETFs industry in Canada reached a new record of US$417.72 billion at the end of February, according to ETFGI's February 2025 Canadian ETFs and ETPs industry landscape insights report, the monthly report which is part of an annual paid-for research subscription service. (All dollar values in USD unless otherwise noted.)
March 9th marked the 35th anniversary of the listing of the first ETF. The Toronto 35 Index Participation Units “TIPS” began trading on the Toronto Stock Exchange (TSX) on March 9, 1990. TIPs tracked the performance of the 35 largest stocks on the TSX. On March 6, 2000 the TIPs ETF and the TSE 100 Index Participation Fund merged and is now known as the S&P/TSE Index Participation Fund (ticker XIU).
Highlights
- March 9th marked the 35th anniversary of the listing of the first ETF.
- Assets invested in the ETFs industry in Canada reached a record of $417.72 Bn at the end of February beating the previous record of $410.69 Bn at the end of January 2025.
- Assets have increased 5.2% YTD in 2025, going from $397.15 Bn at the end of 2024 to $417.72 Bn.
- Net inflows of $7.83 Bn in February 2025.
- YTD net inflows of $15.26 Bn are the highest on record, while the second highest recorded YTD net inflows was of $9.44 Bn in 2020 and the third highest recorded YTD net inflows of $8.47 Bn in 2024.
- 32nd month of consecutive net inflows.
“The S&P 500 index decreased by 1.30% in February bit is up by 1.44% YTD in 2025. The developed markets excluding the US index increased by 1.31% in February and is up 6.08% YTD in 2025. Luxembourg (up 14.10%) and Spain (up 8.87%) saw the largest increases amongst the developed markets in February. The emerging markets index decreased by 0.04% during February but is up 0.26% in 2025. Indonesia (down 15.94%) and Thailand (down 9.48%) saw the largest decreases amongst emerging markets in February”, according to Deborah Fuhr, managing partner, founder, and owner of ETFGI.
Growth in assets in the ETFs industry in Canada as of the end of February

The ETFs industry in Canada had 1,276 ETFs, with 1,602 listings, assets of $417.72 Bn, from 45 providers listed on 2 exchanges at the end of February.
During February, ETFs gathered net inflows of $7.83 Bn. Equity ETFs reported net inflows of $1.96 Bn during February, bringing YTD net inflows to $4.68 Bn, slightly lower than the $5.09 Bn in net YTD in 2024. Fixed income ETFs gathered net inflows of $1.16 Bn during February, bringing YTD net inflows to $1.70 Bn, higher than the $512.88 Mn in net inflows YTD in 2024. Active ETFs reported net inflows of $4.47 Bn during the month, gathering YTD net inflows of $8.31 Bn, higher than the $3.12 Bn in YTD net inflows in 2024. Crypto ETFs reported net inflows of $15.98 Mn during February, bringing YTD net inflows to $89.57 Mn, higher than the $400.06 Mn in YTD net in 2024.
Substantial inflows can be attributed to the top 20 ETFs by net new assets, which collectively gathered $3.99 Bn during February. BMO Global Equity Fund (BGEQ CN) gathered $747.90 Mn, the largest individual net inflow.
Top 20 ETFs by net new assets February 2025: Canada
|
Name |
Ticker |
Assets |
NNA |
NNA |
|
BGEQ CN |
733.73 |
747.90 |
747.90 |
|
|
BMO Equal Weight Banks Index ETF |
ZEB CN |
3,012.32 |
(13.34) |
434.40 |
|
Vanguard S&P 500 Index ETF |
VFV CN |
15,445.13 |
885.18 |
276.05 |
|
Global X High Interest Savings ETF |
CASH CN |
4,327.27 |
551.00 |
248.98 |
|
BMO Money Market Fund |
ZMMK CN |
2,472.90 |
254.48 |
234.12 |
|
Scotia Canadian Bond Index Tracker ETF |
SITB CN |
525.92 |
223.06 |
212.96 |
|
BMO Ultra Short-Term Bond ETF |
ZST CN |
2,803.01 |
264.74 |
203.75 |
|
iShares Core Equity ETF Portfolio |
XEQT CN |
4,733.39 |
515.99 |
191.10 |
|
Fidelity All-in-One Balanced ETF |
FBAL CN |
1,813.20 |
337.01 |
172.62 |
|
BMO Aggregate Bond Index ETF |
ZAG CN |
7,010.22 |
53.82 |
156.02 |
|
iShares S&P 500 Index ETF |
XUS CN |
6,428.24 |
338.94 |
135.96 |
|
BMO S&P/TSX Capped Composite Index ETF |
ZCN CN |
7,033.11 |
348.36 |
131.83 |
|
iShares MSCI EAFE IMI Index Fund |
XEF CN |
7,298.56 |
440.47 |
129.99 |
|
Vanguard All-Equity ETF Portfolio |
VEQT CN |
4,496.44 |
318.55 |
113.14 |
|
Invesco ESG NASDAQ 100 Index ETF |
QQCE CN |
296.09 |
151.06 |
107.66 |
|
iShares S&P/TSX Capped Energy Index ETF |
XEG CN |
1,086.32 |
(88.24) |
106.23 |
|
iShares 1-5 Year US Investment Grade Corporate Bond Index ETF |
XSHU CN |
232.89 |
115.67 |
100.34 |
|
RBC US Discount Bond ETF |
RUDB CN |
436.24 |
141.19 |
100.14 |
|
TD Canadian Long Term Federal Bond ETF |
TCLB CN |
694.30 |
90.19 |
98.49 |
|
BetaPro Natural Gas Inverse Leveraged Daily Bear ETF |
HND CN |
140.61 |
120.14 |
92.95 |

Investors have tended to invest in Active ETFs during February.


