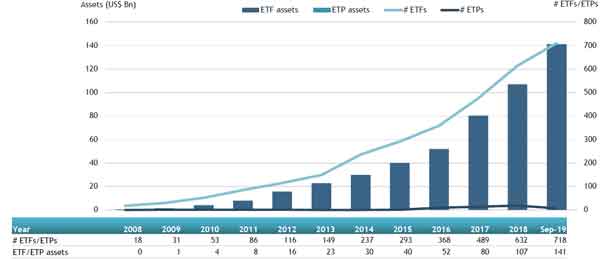
ETFGI, a leading independent research and consultancy firm covering trends in the global ETFs/ETPs ecosystem, reported today that actively managed ETFs and ETPs gathered net inflows of IUS$4.24 billion in September, bringing year-to-date net inflows to US$28.37 billion. Assets invested in actively managed ETFs/ETPs finished the month up 3.5%, from US$136.43 billion at the end of August to US$141.21 billion, according to ETFGI's September 2019 Active ETFs and ETPs industry landscape insights report, an annual paid-for research subscription service. (All dollar values in USD unless otherwise noted.)
Highlights
- Assets invested in actively managed ETFs/ETPs reached a new record of $141.21 billion
- During September 2019, actively managed ETFs/ETPs attracted $4.24 billion in net inflows.
- Fixed income based actively managed ETFs/ETPs still remain the most popular.
At the end of September 2019, the global active ETF/ETP industry had 718 ETFs/ETPs, with 938 listings, from145 providers on 23 exchanges in 58 countries. Following net inflows of $4.24 billion and market moves during the month, assets invested in the actively managed ETF/ETP industry increased by 3.5% from $136.43 billion at the end of September to $141.21 billion.
Growth in actively managed ETF and ETP assets as of the end of September 2019

Equity focused actively managed ETFs/ETPs listed globally attracted net inflows of $336 million in September, bringing net inflows for the year to September 2019 to $4.87 billion, less than the $6.03 billion in net inflows equity products had attracted for the year to September 2018. Fixed income focused actively managed ETFs/ETPs listed globally attracted net inflows of $3.57 billion in September, bringing net inflows for the year to September 2019 to $22.74 billion, greater than the $17.23 billion in net inflows fixed income products had attracted for the year to September 2018.
Substantial inflows can be attributed to the top 20 ETFs/ETPs by net new assets, which collectively gathered $3.39 billion in September, Franklin Liberty U.S. Core Bond ETF gathered $537.84 million alone.
Top 20 actively managed ETFs/ETPs by net new assets September 2019
|
Name |
Ticker |
Assets |
NNA |
NNA |
|
Franklin Liberty U.S. Core Bond ETF |
FLCB US |
538.91 |
537.84 |
537.84 |
|
JPMorgan Ultra-Short Income ETF |
JPST US |
8,862.68 |
3,698.20 |
486.86 |
|
iShares Liquidity Income ETF |
ICSH US |
2,128.98 |
1,241.71 |
269.34 |
|
SPDR Blackstone/GSO Senior Loan ETF |
SRLN US |
2,236.77 |
(18.41) |
254.19 |
|
First Trust Preferred Securities and Income Fund |
FPE US |
4,424.79 |
1,032.07 |
211.09 |
|
First Trust Low Duration Mortgage Opportunities ETF |
LMBS US |
3,550.50 |
1,461.43 |
189.39 |
|
JPMorgan EUR Ultra-Short Income UCITS ETF |
JSET LN |
493.98 |
377.37 |
171.68 |
|
Purpose High Interest Savings ETF |
PSA CN |
1,582.33 |
509.41 |
147.43 |
|
First Trust Enhanced Short Maturity Fund |
FTSM US |
4,891.89 |
813.85 |
129.26 |
|
PIMCO Enhanced Short Maturity Strategy Fund |
MINT US |
12,787.71 |
501.03 |
128.18 |
|
BMO Low Volatility Canadian Equity ETF |
ZLB CN |
1,574.68 |
552.55 |
112.02 |
|
iShares Commodities Select Strategy ETF |
COMT US |
517.42 |
107.17 |
100.25 |
|
CI First Asset High Interest Savings ETF |
CSAV CN |
275.74 |
273.86 |
98.36 |
|
iShares Short Maturity Bond ETF |
NEAR US |
6,847.60 |
891.94 |
88.05 |
|
PGIM Ultra Short Bond ETF |
PULS US |
647.42 |
465.66 |
85.14 |
|
Invesco Optimum Yield Diversified Commodity Strategy No K-1 ETF |
PDBC US |
1,540.11 |
(363.71) |
81.45 |
|
BMO Low Volatility US Equity ETF |
ZLU CN |
1,023.31 |
370.87 |
81.43 |
|
First Trust Managed Municipal ETF |
FMB US |
1,064.86 |
525.33 |
80.45 |
|
Mirae Asset TIGER USD Money Market Active ETF |
329750 KS |
129.72 |
130.46 |
68.44 |
|
First Trust Tactical High Yield ETF |
HYLS US |
1,393.65 |
155.11 |
67.53 |

Investors have tended to invest in actively managed Fixed Income ETFs/ETPs during September.


.jpg)


