ETFGI, a leading independent research and consultancy firm covering trends in the global ETFs/ETPs ecosystem, reported today that actively managed ETFs and ETPs gathered net inflows of
US$3.39 billion in November, bringing year-to-date net inflows to US$37.29 billion. Assets invested in actively managed ETFs/ETPs finished the month up 2.7%, from US$147.30 billion at the end of October to US$151.24 billion, according to ETFGI's November 2019 Active ETFs and ETPs industry landscape insights report, an annual paid-for research subscription service. (All dollar values in USD unless otherwise noted.)
Highlights
- Assets in actively managed ETFs/ETPs reached a new record of $151.24 billion.
- During November 2019, actively managed ETFs/ETPs attracted $3.39 billion in net inflows.
- Fixed income ETFs/ETPs still remain the most popular accounting for 70% of all assets.
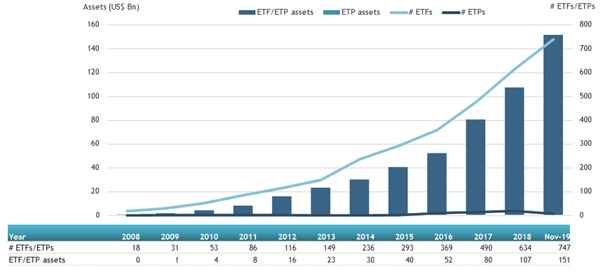
At the end of November 2019, the global active ETF/ETP industry had 747 ETFs/ETPs, with 964 listings, from 147 providers on 24 exchanges in 58 countries. Following net inflows of $3.39 billion and market moves during the month, assets invested in the actively managed ETF/ETP industry increased by 2.7% to $151.24 billion.
Growth in actively managed ETF and ETP assets as of the end of November 2019

Equity focused actively managed ETFs/ETPs listed globally attracted net inflows of $19.0 million in October, bringing net inflows for the year to October 2019 to $6.42 billion, slightly less than the $6.47 billion in net inflows equity products had attracted for the year to November 2018. Fixed income focused actively managed ETFs/ETPs listed globally attracted net inflows of $3.47 billion in November, bringing net inflows for the year to November 2019 to $29.94 billion, greater than the $24.32 billion in net inflows fixed income products had attracted for the year to November 2018.
Substantial inflows can be attributed to the top 20 ETFs/ETPs by net new assets, which collectively gathered
$3.39 billion in November, JPMorgan Ultra-Short Income ETF (JPST US) gathered $580.16 million alone.
Top 20 actively managed ETFs/ETPs by net new assets November 2019
|
Name |
Ticker |
Assets |
NNA |
NNA |
|
JPMorgan Ultra-Short Income ETF |
JPST US |
10005.21 |
4904.04 |
580.16 |
|
PIMCO Enhanced Short Maturity Strategy Fund |
MINT US |
13387.36 |
1098.63 |
305.94 |
|
iShares Liquidity Income ETF |
ICSH US |
2441.40 |
1561.39 |
254.21 |
|
JPMorgan Global Emerging Markets Research Enhanced Index Equity ESG UCITS ETF |
JREM LN |
224.93 |
217.03 |
201.25 |
|
First Trust Preferred Securities and Income Fund |
FPE US |
4861.78 |
1443.02 |
197.90 |
|
Franklin Liberty Investment Grade Corporate ETF |
FLCO US |
580.22 |
548.35 |
179.71 |
|
SPDR Blackstone/GSO Senior Loan ETF |
SRLN US |
2276.42 |
30.04 |
162.65 |
|
PIMCO US Dollar Short Maturity ETF |
MINT LN |
3881.41 |
1451.78 |
139.88 |
|
First Trust Low Duration Mortgage Opportunities ETF |
LMBS US |
3883.91 |
1814.09 |
137.34 |
|
CI First Asset High Interest Savings ETF |
CSAV CN |
709.92 |
719.82 |
133.64 |
|
Invesco Ultra Short Duration ETF |
GSY US |
2726.36 |
666.10 |
115.94 |
|
PIMCO Total Return Active Exchange-Traded Fund |
BOND US |
2863.00 |
748.65 |
113.73 |
|
BMO Low Volatility Canadian Equity ETF |
ZLB CN |
1777.80 |
726.85 |
91.72 |
|
First Trust TCW Opportunistic Fixed Income ETF |
FIXD US |
1182.97 |
734.11 |
91.60 |
|
ARK Web x.O ETF |
ARKW US |
497.13 |
-4.88 |
83.81 |
|
Firozeh Asia |
FIRO1 |
116.85 |
85.76 |
77.87 |
|
ICBC CICC USD Money Market ETF |
9011 HK |
212.36 |
215.95 |
75.81 |
|
Fidelity Limited Term Bond ETF |
FLTB US |
213.99 |
81.48 |
73.78 |
|
First Trust Managed Municipal ETF |
FMB US |
1193.42 |
660.99 |
63.54 |
|
IQ Ultra Short Duration Etf |
ULTR US |
92.71 |
92.59 |
62.60 |
Investors have tended to invest in actively managed Fixed Income ETFs/ETPs during November.


.jpg)


