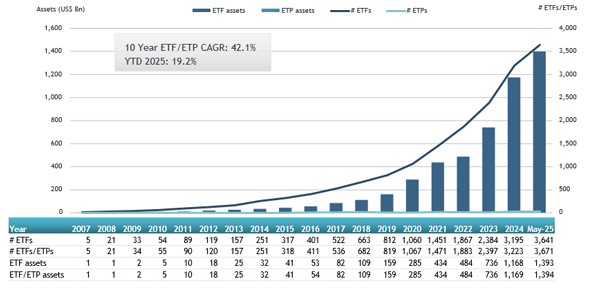
ETFGI, a leading independent research and consultancy firm renowned for its expertise in subscription research, consulting services, events, and ETF TV on global ETF industry trends, reports today that assets invested in the actively managed ETFs listed globally reached a new record of US$1.39 trillion at the end of May. During May the actively managed ETFs listed globally gathered net inflows of US$43.49 billion, bringing year-to-date net inflows to a record US$220.25 billion, according to ETFGI's May 2025 Active ETF industry landscape insights report, an annual paid-for research subscription service. (All dollar values in USD unless otherwise noted.)
- Assets invested in actively managed ETFs listed globally reached a new all-time high of $1.39 trillion at the end of May 2025, surpassing the previous record of $1.30 trillion set just a month earlier in April.
- Net inflows of $43.49 Bn in May 2025.
- Year-to-date (YTD) net inflows have reached a record high of $220.25 billion in 2025, surpassing the previous high of $124.63 billion in 2024. The third-highest YTD net inflow was recorded in 2021 at $72.01 billion.
- 62nd month of consecutive net inflows.
“The S&P 500 Index rose by 6.29% in May, bringing its year-to-date (YTD) gain to 1.06% in 2025. The Developed Markets ex-U.S. Index increased by 5.12% in May and is up 16.52% YTD. Among developed markets, Austria and the Netherlands led with gains of 11.40% and 9.12%, respectively. The Emerging Markets Index climbed 4.42% in May, with a 6.30% YTD increase. Taiwan and Greece posted the strongest monthly performances among emerging markets, rising 12.57% and 10.99%, respectively,” according to Deborah Fuhr, managing partner, founder, and owner of ETFGI.
Growth in assets in the actively managed ETFs listed globally as of end of May

There are now 3,671 actively managed ETFs listed globally, with 4,757 listings, assets of $1.39 Tn, from 563 providers listed on 42 exchanges in 33 countries at the end of May.
During May the actively managed ETFs listed globally gathered net inflows of US$43.49 billion. Equity focused actively managed ETFs gathered net inflows of $28.15 Bn during May, bringing year to date net inflows to $124.33 Bn, higher than the $74.57 Bn in YTD net inflows in 2024. Fixed Income focused actively managed ETFs reported net inflows of $17.05 Bn during May, bringing YTD net inflows to $82.09 Bn, much higher than the $43.38 Bn in net inflows YTD in 2024.
Substantial inflows can be attributed to the top 20 active ETFs by net new assets, which collectively gathered $17.29 Bn during May. iShares U.S. Thematic Rotation Active ETF (THRO US) gathered $3.77 Bn, the largest individual net inflow.
Top 20 actively managed ETFs/ETPs by net new assets May 2025
|
Name |
Ticker |
Assets |
NNA |
NNA |
|
iShares U.S. Thematic Rotation Active ETF |
THRO US |
4,368.00 |
4,341.12 |
3,768.08 |
|
iShares AI Innovation and Tech Active ETF |
BAI US |
1,694.36 |
1,627.98 |
1,527.57 |
|
JPMorgan Nasdaq Equity Premium Income ETF |
JEPQ US |
26,287.80 |
6,975.15 |
1,341.01 |
|
YieldMax MSTR Option Income Strategy ETF |
MSTY US |
4,098.14 |
3,137.52 |
1,306.04 |
|
Avantis Emerging Markets Equity ETF |
AVEM US |
9,799.67 |
1,971.36 |
1,194.72 |
|
iShares U.S. Equity Factor Rotation Active ETF |
DYNF US |
17,514.09 |
3,595.49 |
926.37 |
|
Capital Group Dividend Value ETF |
CGDV US |
16,677.01 |
3,688.27 |
686.17 |
|
Janus Henderson AAA CLO ETF |
JAAA US |
20,906.78 |
4,318.15 |
649.07 |
|
JPMorgan Equity Premium Income ETF |
JEPI US |
39,907.95 |
3,959.06 |
637.62 |
|
Blackrock Flexible Income ETF |
BINC US |
9,362.82 |
2,434.82 |
628.85 |
|
JPMorgan Ultra-Short Income ETF |
JPST US |
31,103.07 |
2,913.54 |
570.35 |
|
Alpha Architect 1-3 Month Box ETF |
BOXX US |
6,445.43 |
1,846.43 |
542.42 |
|
PIMCO Multi Sector Bond Active ETF |
PYLD US |
5,466.89 |
2,711.20 |
515.18 |
|
SAMSUNG KODEX Money Market Active ETF |
488770 KS |
5,019.11 |
2,055.62 |
503.21 |
|
JPMorgan Income ETF |
JPIE US |
3,883.05 |
1,346.89 |
488.25 |
|
Yinhua Traded Money Market Fund |
511880 CH |
10,792.46 |
2,260.90 |
433.65 |
|
Capital Group Growth ETF |
CGGR US |
12,222.60 |
2,635.93 |
418.88 |
|
Fidelity Total Bond ETF |
FBND US |
18,600.06 |
1,586.07 |
409.89 |
|
PGIM Ultra Short Bond ETF |
PULS US |
11,330.67 |
2,150.09 |
382.01 |
|
Neos Nasdaq-100 High Income ETF |
QQQI US |
1,756.21 |
1,039.56 |
356.08 |

Investors have tended to invest in Equity actively managed ETFs/ETPs during May.


