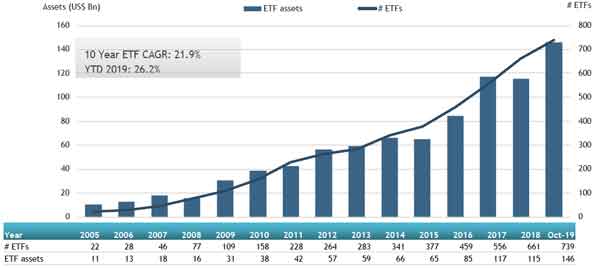
ETFGI, a leading independent research and consultancy firm covering trends in the global ETFs/ETPs ecosystem, reported today that ETFs listed in Canada saw net inflows of US$2.82 billion in October, bringing year-to-date net inflows to US$14.16 billion which is significantly more than the US$12.36 billion gathered at this point last year. In the month, Canadian ETF assets increased by 2.8%, from US$141.75 billion in September to US$145.69 billion. Year-to-date through the end of October, Canadian ETF assets increased 26.2% from US$115.48 billion to US$145.69 billion. At the end of October 2019, the Canadian ETF/ETP industry had 739 ETFs/ETPs, with 898 listings, from 38 providers on 2 exchanges. (All dollar values in USD unless otherwise noted.)
Highlights
- Assets invested in the Canadian ETF/ETP industry reached a record of $145.69 billion in October.
- Assets invested in the Canadian ETF/ETP industry increased by 2.8% in October.
- In October 2019, ETFs/ETPs listed in Canada saw $2.82 billion in net inflows.
- Year-to-date net inflows are $14.16 billion which is significantly more than the $12.36 billion gathered at this point in 2018
Less than 2 weeks left to Register to join us in discussions with leading ETF issuers, investors, traders, analysts, regulators, and lawyers – at the ETFGI Global ETFs Insights Summit on December 2nd from 8am – 4:45pm in Toronto at the St Regis Toronto hotel.
ETFGI Global ETFs Insights Summit Toronto qualifies for 6 FP Canada-Approved CE Credits. Complimentary registration is available for buyside institutional investors and financial advisors including traders, portfolio managers and fund selectors. Register here. Attendees will receive a complimentary copy of the CFA Institute's book: "A comprehensive Guide to Exchange Traded Funds (ETFs)"
“The Fed rate cut and the looming hope for an agreement between US-China shaped a favourable investment environment in equity markets globally which led the S&P 500® to gain 3.2% during October. International markets also gained, with the S&P Developed Ex-U.S. and the S&P Emerging BMI both up 4%. The better performance of the Equity Markets reflected into a new record high of $145.69 billion and higher inflows of ETFs/ETPs exposed to Equity Indices rather than Fixed Income.” According to Deborah Fuhr, managing partner, founder and owner of ETFGI.
Growth in Canadian ETF and ETP assets as of the end of October 2019


Active ETFs/ETPs gained inflows of $1.28 billion in October, bringing net inflows for the year to October 2019 to $7.39 billion, higher than the $6.19 billion in net inflows active products had attracted at this point in 2018. Equity ETFs/ETPs gathered net inflows of $1.05 billion in October, bringing net inflows for the year to October 2019 to $2.84 billion, considerably lower than the $6.15 billion in net inflows equity products had attracted by the end of October 2018. Fixed income ETFs and ETPs experienced net inflows of $556 Mn in October, growing year to date net inflows to $3.59 Bn, which is greater than the same period last year which saw net inflows of $244 Mn.
Substantial inflows can be attributed to the top 20 ETFs by net new assets, which collectively gathered $2.39 billion in October, CI First Asset High Interest Savings ETF (CSAV CN) gathered $312.32 million alone.
Top 20 ETFs by net new assets October 2019: Canada
|
Name |
Ticker |
Assets |
NNA |
NNA |
|
CI First Asset High Interest Savings ETF |
CSAV CN |
588.74 |
586.18 |
312.32 |
|
iShares Core S&P/TSX Capped Composite Index ETF |
XIC CN |
4,016.32 |
319.80 |
302.84 |
|
Vanguard FTSE Developed All Cap EX North America Index ETF |
VIU CN |
958.76 |
389.74 |
213.59 |
|
Purpose High Interest Savings ETF |
PSA CN |
1,748.70 |
665.87 |
156.46 |
|
BMO Aggregate Bond Index ETF |
ZAG CN |
3,802.55 |
992.96 |
149.18 |
|
Horizon S&P/TSX 60 Index ETF |
HXT CN |
1,551.40 |
(12.47) |
146.49 |
|
BMO Low Volatility US Equity ETF |
ZLU CN |
1,140.32 |
498.89 |
128.02 |
|
RBC Target 2021 Corporate Bond Index ETF |
RQI CN |
225.89 |
142.44 |
124.72 |
|
BMO Long Federal Bond Index ETF |
ZFL CN |
1,098.03 |
844.49 |
112.09 |
|
iShares Core Canadian Universe Bond Index ETF |
XBB CN |
2,537.87 |
630.01 |
102.02 |
|
iShares S&P/TSX 60 Index Fund |
XIU CN |
6,266.43 |
(1,375.47) |
93.50 |
|
BMO Low Volatility Canadian Equity ETF |
ZLB CN |
1,632.80 |
635.13 |
82.58 |
|
AGFiQ US Market Neutral Anti-Beta CAD-Hedged ETF |
QBTL CN |
73.06 |
71.76 |
71.76 |
|
Fidelity Global Core Plus Bond ETF |
FCGB CN |
74.34 |
74.05 |
64.63 |
|
BMO S&P 500 Index ETF |
ZSP CN |
4,907.50 |
582.85 |
64.41 |
|
AGFiQ US Long/short Dividend Income CAD-Hedged ETF |
QUDV CN |
63.63 |
62.08 |
62.08 |
|
BMO Ultra Short-Term US Bond ETF |
ZUS/U CN |
100.17 |
100.38 |
54.77 |
|
Mackenzie Emerging Markets Local Currency Bond Index ETF |
QEBL CN |
53.62 |
53.79 |
53.79 |
|
iShares S&P/TSX Capped Energy Index ETF |
XEG CN |
476.15 |
(96.24) |
50.93 |
|
Brompton Global Dividend Growth Etf |
BDIV CN |
49.74 |
48.14 |
48.14 |

Investors have tended to invest in Active and Equity ETFs in October.


