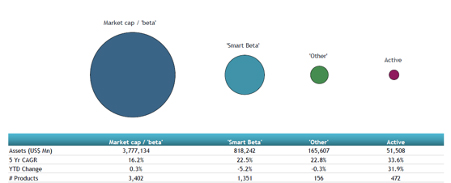
ETFGI, a leading independent research and consultancy firm covering trends in the global ETFs/ETPs ecosystem, reported today that equity-based Smart Beta ETFs and ETPs listed globally saw net outflows of US$2.22 billion during July bringing year-to-date net inflows to US$10.36 billion which is significantly lower than the US$52.90 billion gathered at this point last year. July marked the third consecutive month of net outflows for Smart Beta ETFs and ETPs listed globally. Year-to-date through the end of July, Smart Beta Equity ETF and ETP assets have decreased by 5.2% from US$863 billion to US$818 billion, with a 5-year CAGR of 22.5%, according to ETFGI’s July 2020 ETF and ETP Smart Beta industry landscape insights report, a monthly report which is part of an annual paid-for research subscription service. (All dollar values in USD unless otherwise noted.)
Highlights
- Smart Beta ETFs and ETPs listed globally suffered net outflows of US$ 2.2 Bn during July
- YTD net inflows are $10.36 Bn which is significantly lower than the $52.90 Bn gathered at this point in 2019.
- YTD through the end of July, Smart Beta Equity ETF/ETP assets have decreased by 5.2% from $863 Bn to US$818 Bn.
“The S&P 500 gained 5.6% in July, aided by the U.S. Federal Reserve stimulus and strong earnings. International markets also gained, with Developed Ex-U.S. and Emerging up 3.0% and 8.5%, respectively. In the developed markets Scandinavian countries benefited most, led by Norway (up 10.8%) and Sweden (up 10.1%); while Japan (down 2.0%) was the sole negative performer among developed countries. Dollar weakness contributed toward the positive momentum in Emerging markets where 19 of 25 countries gained, led by Brazil (up 14.4%) and Pakistan (up 13.4%), while Taiwan (up 12.1%) neared an all-time high.” According to Deborah Fuhr, managing partner, founder and owner of ETFGI.
Comparison of assets in market cap, smart beta, other and active equity products

At the end of July 2020, there were 1,351 smart beta equity ETFs/ETPs, with 2,540 listings, assets of US$818 Bn, from 179 providers listed on 41 exchanges in 33 countries.
Substantial inflows can be attributed to the top 20 Smart Beta ETFs/ETPs by net new assets, which collectively gathered $4.30 Bn during July. The iShares Edge MSCI USA Value Factor ETF (VLUE US) gathered $587.05 Mn alone.
Top 20 Smart Beta ETFs/ETPs by net new assets July 2020
|
Name |
Ticker |
Assets |
NNA |
NNA |
|
iShares ESG MSCI USA ETF |
ESGU US |
8036.15 |
5806.75 |
587.05 |
|
Cathay Taiwan Select ESG Sustainability High Yield ETF |
00878 TT |
497.15 |
493.20 |
493.20 |
|
WisdomTree U.S. Dividend Growth Fund |
DGRW US |
3791.51 |
522.01 |
318.98 |
|
iShares MSCI EAFE Growth ETF |
EFG US |
7994.45 |
3031.67 |
311.20 |
|
Goldman Sachs ActiveBeta U.S. Large Cap Equity ETF - Acc |
GSLC US |
8967.30 |
1176.36 |
229.94 |
|
iShares ESG MSCI EAFE ETF |
ESGD US |
2719.61 |
1309.20 |
217.89 |
|
SPDR Portfolio S&P 500 Value ETF |
SPYV US |
5143.68 |
684.92 |
213.44 |
|
iShares Edge MSCI USA Momentum Factor ETF |
MTUM US |
10647.60 |
316.19 |
193.97 |
|
SPDR Portfolio S&P 500 Growth ETF |
SPYG US |
8642.73 |
2119.01 |
181.02 |
|
Invesco S&P SmallCap Low Volatility ETF |
XSLV US |
1419.63 |
(132.54) |
168.33 |
|
Manulife Multifactor Developed International Index ETF |
MINT/B CN |
294.20 |
166.17 |
167.82 |
|
Vanguard Mega Cap Growth ETF |
MGK US |
8663.63 |
1923.22 |
150.00 |
|
Amplify Online Retail ETF - Acc |
IBUY US |
766.54 |
287.91 |
149.40 |
|
CSIF IE MSCI World ESG Leaders Minimum Volatility Blue UCITS ETF |
CSY9 GY |
142.36 |
143.19 |
143.19 |
|
First Trust Capital Strength ETF |
FTCS US |
5613.80 |
1871.68 |
138.19 |
|
Manulife Multifactor Emerging Markets Index Etf |
MEME/B CN |
215.00 |
138.02 |
138.02 |
|
iShares Edge MSCI Europe Momentum Factor UCITS ETF - Acc |
IEFM LN |
411.52 |
138.37 |
126.98 |
|
Invesco S&P 500 Equal Weight Industrials ETF |
RGI US |
315.74 |
95.23 |
125.97 |
|
iShares Edge MSCI USA Momentum Factor UCITS ETF - Acc |
IUMO LN |
612.07 |
144.44 |
124.74 |
|
Schwab US Dividend Equity ETF |
SCHD US |
11868.58 |
863.96 |
122.32 |


