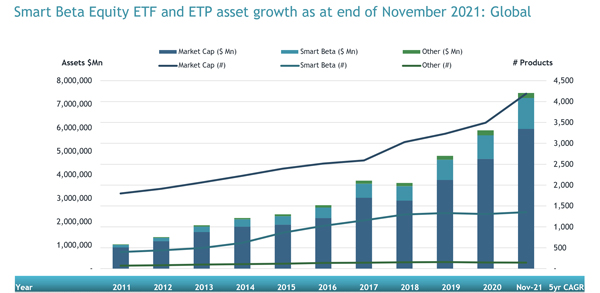
ETFGI, a leading independent research and consultancy firm covering trends in the global ETFs/ETPs ecosystem, reported today that equity-based Smart Beta ETFs and ETPs listed globally gathered net inflows of US$12.72 billion during November, bringing year-to-date net inflows to US$148.28 billion which is higher than the US$42.59 billion gathered at this point last year. Year-to-date through the end of November 2021, Smart Beta Equity ETF/ETP assets have increased by 31.7% from US$999 billion to US$1.32 trillion, with a 5-year CAGR of 22.8%, according to ETFGI’s November 2021 ETF and ETP Smart Beta industry landscape insights report, the monthly report which is part of an annual paid-for research subscription service. (All dollar vales in USD unless otherwise noted.)
Highlights
- Assets of $1.32 Tn invested in Smart Beta ETFs and ETPs listed globally are 2nd highest on record.
- Assets have increased 31.7% YTD going from $999 Bn at end of 2020 to $1.32 Tn at end of November.
- Smart Beta ETFs and ETPs listed globally gathered net inflows of $12.72 Bn during November
- Record YTD net inflows of $148.28 Bn beat prior record of $81.37 Bn gathered YTD 2019.
- $148.28 Bn YTD net inflows are $58.48 Bn or 65% greater than the full year 2019 record net inflows of $89.80 Bn.
- $159.65 Bn in net inflows gathered in the past 12 months.
- 16th month of consecutive net inflows
“Due to the growing threat of a new COVID variant Omicron, the S&P 500 declined 0.69% in November, however, the index is up 23.18% year to date. Developed markets, excluding the US, experienced a fall of 4.94% in November. Israel (down 1.03%) and the US (down 1.47%) experienced the smallest losses among the developed markets in November, while Luxembourg suffered the biggest loss of 16.90%. Emerging markets declined 3.53% during November. United Arab Emirates (up 8.15%) and Chile (up 5.51%) gained the most, whilst Turkey (down 13.72%) and Poland (down 11.95%) witnessed the largest declines.” According to Deborah Fuhr, managing partner, founder and owner of ETFGI.

At the end of November 2021, there were 1,360 smart beta equity products, with 2,771 listings, assets of $1.32 Tn, from 200 providers listed on 47 exchanges in 37 countries.
In November 2021, Smart Beta products saw net inflows of $12.72 Bn. Dividend factor based products gathered the largest net inflows with $3.06 Bn, followed by growth factor products with $3.01 Bn and alternative weighting with $2.42 Bn, while Volatility factors experienced the largest net outflows with $114 Mn. Year to date in 2021, Smart Beta products have seen net inflows of $148,277 Mn. Value factor gathered the largest net inflows with $53.31 Bn, followed by dividend factor based products with $29.11 Bn and alternative weighting with $28.10 Bn, while Volatility factors experienced the largest net outflows with $2.13 Bn.
Substantial inflows can be attributed to the top 20 Smart Beta ETFs/ETPs by net new assets, which collectively gathered $9.58 Bn during November. Vanguard Value ETF (VTV US) gathered $1.27 Bn the largest individual net inflow.
Top 20 Smart Beta ETFs/ETPs by net new assets November 2021
|
Name |
Ticker |
Assets |
NNA |
NNA |
|
Vanguard Value ETF |
VTV US |
88,927.85 |
14,860.99 |
1,270.14 |
|
iShares Trust iShares ESG Aware MSCI USA ETF |
ESGU US |
24,123.28 |
7,469.83 |
806.52 |
|
SPDR Portfolio S&P 500 Growth ETF |
SPYG US |
15,812.87 |
3,259.20 |
803.11 |
|
Schwab US Dividend Equity ETF |
SCHD US |
30,548.07 |
10,347.43 |
725.50 |
|
Vanguard Dividend Appreciation ETF |
VIG US |
66,085.42 |
3,359.55 |
666.06 |
|
SPDR S&P 400 Mid Cap Growth ETF |
MDYG US |
2,250.79 |
8.55 |
597.80 |
|
First Trust Rising Dividend Achievers ETF |
RDVY US |
7,061.36 |
4,577.72 |
513.29 |
|
Vanguard Small-Cap Value ETF |
VBR US |
26,244.16 |
3,904.71 |
504.43 |
|
iShares MSCI USA ESG Select ETF |
SUSA US |
4,497.90 |
1,541.41 |
466.44 |
|
Lyxor Net Zero 2050 S&P Eurozone Climate PAB (DR) UCITS ETF - Acc |
EPAB FP |
1,519.44 |
1,147.16 |
434.05 |
|
iShares MSCI EAFE Growth ETF |
EFG US |
12,658.13 |
2,174.04 |
356.29 |
|
iShares Core Dividend Growth ETF |
DGRO US |
21,529.83 |
3,684.11 |
320.02 |
|
iShares ESG MSCI EAFE ETF |
ESGD US |
7,064.30 |
2,950.45 |
316.48 |
|
Vanguard Mega Cap Growth ETF |
MGK US |
13,969.94 |
1,265.97 |
304.14 |
|
iShares S&P/TSX Composite High Dividend Index ETF |
XEI CN |
1,132.38 |
336.17 |
271.50 |
|
Huatai-PineBridge Dividend ETF |
510880 CH |
2,723.07 |
1,184.40 |
260.41 |
|
BMO Equal Weight Banks Index ETF |
ZEB CN |
1,967.93 |
568.13 |
251.89 |
|
Invesco Dynamic Large Cap Value ETF |
PWV US |
1,016.65 |
202.42 |
239.48 |
|
Yuanta Taiwan High Dividend LowVolatility ETF |
00713 TT |
342.25 |
226.72 |
237.57 |
|
iShares Select Dividend ETF |
DVY US |
18,254.04 |
798.41 |
233.75 |


