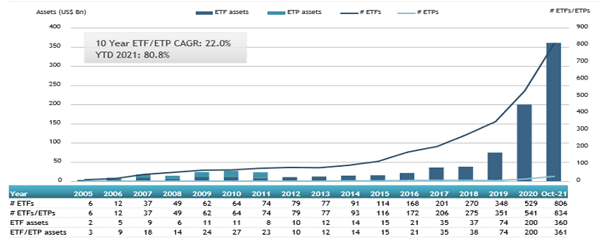
ETFGI, a leading independent research and consultancy firm covering trends in the global ETFs/ETPs ecosystem, reported today record year to date net inflows into Environmental, Social, and Governance (ESG) ETFs and ETPs listed globally of US$ 130 billion which is 49% higher than the record full year 2020 net inflows. ESG ETFs and ETPs listed globally gathered net inflows of US$11.25 billion during October, bringing year-to-date net inflows to US$130.28 billion which is much higher than the US$54.91 billion gathered at this point last year. Total assets invested in ESG ETFs and ETPs increased by 9.1% from US$331 billion at the end of September 2021 to US$361 billion, according to ETFGI’s October 2021 ETF and ETP ESG industry landscape insights report, the monthly report which is part of an annual paid-for research subscription service. (All dollar values in USD unless otherwise noted.)
- Record $361 billion invested in ETFs and ETPs listed globally at the end of October.
- Assets increased 80.8% YTD in 2021, going from US$200 billion at end of 2020, to US$361 billion.
- Record YTD 2021 net inflows of $130.28 Bn beating the prior record of $54.91 Bn gathered YTD 2020.
- $130.28 Bn YTD net inflows are $43.29 Bn or 49% over full year 2020 record net inflows $86.99 Bn.
- $162.36 billion in net inflows gathered in the past 12 months.
- 34th month of consecutive net inflows.
- Equity ETFs and ETPs listed globally gathered a record $98.07 Bn in YTD net inflows 2021.
“Due to strong corporate earnings the S&P 500 gained 7.01% in October and is up 24.04% year to date. Developed markets ex-U.S. experienced gains of 2.50% in October. Canada 7.46% and Sweden 7.21% were the leaders of the month while Japan suffer the biggest loss of 3.43%. Emerging markets were up by 1.00% during October. Peru (up 14.45%) and Egypt (up 10.76%) were the leaders, whilst Brazil (down 10.72%) and Chile (down 5.66%) were down the most.” According to Deborah Fuhr, managing partner, founder and owner of ETFGI
Global ESG ETF and ETP asset growth as at end of October 2021

The Global ESG ETF/ETP had 834 products, with 2,344 listings, assets of $361 Bn, from 170 providers listed on 40 exchanges in 32 countries. Following net inflows of $11.25 Bn and market moves during the month, assets invested in ESG ETFs/ETPs listed globally increased by 9.1% from $331 Bn at the end of September 2021 to $361 Bn at the end of October 2021.
Since the launch of the first ESG ETF/ETP in 2002, the iShares MSCI USA ESG Select ETF, the number and diversity of products have increased steadily. During October, 27 new ESG ETFs/ETPs were launched.
Substantial inflows can be attributed to the top 20 ETFs/ETPs by net new assets, which collectively gathered
$5.18 Bn in October. Deka MSCI USA Climate Change ESG UCITS ETF (D6RQ GY) gathered $620 Mn the largest net inflows.
Top 20 ESG ETFs/ETPs by net new assets October 2021
|
Name |
Ticker |
Assets (US$ Mn) Oct-21 |
NNA (US$ Mn) YTD-21 |
NNA (US$ Mn) Oct-21 |
|
Deka MSCI USA Climate Change ESG UCITS ETF |
D6RQ GY |
1,280.98 |
996.89 |
620.09 |
|
Invesco Solar ETF |
TAN US |
4,181.88 |
853.78 |
510.56 |
|
iShares Trust iShares ESG Aware MSCI USA ETF |
ESGU US |
23,633.30 |
6,663.31 |
444.79 |
|
Think Sustainable World UCITS ETF |
TSWE NA |
556.77 |
386.43 |
360.82 |
|
iShares MSCI World SRI UCITS ETF - EUR - Acc |
SUSW LN |
4,503.88 |
1,403.69 |
328.71 |
|
Invesco Nasdaq-100 ESG UCITS ETF - Acc |
NESP LN |
3.18 |
310.32 |
310.32 |
|
Quadratic Interest Rate Volatility and Inflation ETF |
IVOL US |
3,614.11 |
2,767.82 |
296.14 |
|
AMUNDI INDEX MSCI EM ASIA SRI - UCITS ETF DR (D) |
SADA GY |
271.65 |
265.76 |
260.25 |
|
Xtrackers MSCI USA ESG UCITS ETF - 1C - Acc |
XZMU GY |
4,131.70 |
1,822.60 |
247.63 |
|
Vanguard ESG US Stock ETF |
ESGV US |
5,785.98 |
1,925.18 |
237.21 |
|
Vanguard ESG International Stock ETF |
VSGX US |
2,825.93 |
1,157.32 |
211.72 |
|
AMUNDI S&P 500 ESG UCITS ETF |
S500 FP |
981.57 |
496.76 |
178.12 |
|
iShares ESG MSCI EAFE ETF |
ESGD US |
7,110.70 |
2,633.97 |
164.96 |
|
AMUNDI INDEX MSCI EUROPE SRI - UCITS ETF DR (C) - Acc |
EUSRI FP |
2,543.03 |
534.62 |
157.30 |
|
Global X Conscious Companies ETF |
KRMA US |
742.93 |
244.23 |
157.01 |
|
iShares Global Clean Energy ETF |
ICLN US |
6,910.01 |
3,001.97 |
154.99 |
|
KraneShares Global Carbon ETF |
KRBN US |
1,065.92 |
903.34 |
142.16 |
|
Lyxor Net Zero 2050 S&P Eurozone Climate PAB (DR) UCITS ETF - Acc |
EPAB FP |
1,178.84 |
713.10 |
135.20 |
|
iShares MSCI EM ESG Enhanced UCITS ETF |
EDM2 GY |
1,332.93 |
654.48 |
131.42 |
|
iShares MSCI USA ESG Select ETF |
SUSA US |
4,101.13 |
1,074.97 |
128.94 |

Confusion persists around what constitutes an ESG fund. According to PRI, a UN-supported initiative which seeks to understand the investment implications of ESG issues, 56% of adopters believe there is a lack of clarity in ESG definitions. ETFGI’s classification system attempts to provide greater precision, with ETFs/ETPs listed globally organised into categories, including core ESG products and theme-based groups, such as Clean/Alternative Energies and Gender Diversity. Please contact deborah.fuhr@etfgi.com if you would like to discuss the cost to subscribe to any of ETFGI’s research or consulting services.


