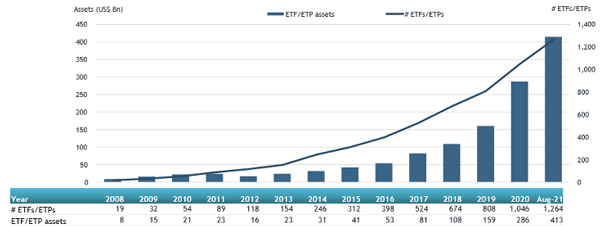
ETFGI, a leading independent research and consultancy firm covering trends in the global ETFs and ETPs ecosystem, reported today record assets and net inflows in Active ETFs and ETPs listed globally of US$413 billion and US$95 billion respectively at the end of August. Actively managed ETFs and ETPs saw net inflows of US$7.00 billion during August, bringing year-to-date net inflows to US$95.21 billion. Assets invested in actively managed ETFs/ETPs finished the month up to 2.4%, from US$404 billion at the end of July to US$413 billion, according to ETFGI's August 2021 Active ETF and ETP industry landscape insights report, the monthly report which is part of an annual paid-for research subscription service. (All dollar values in USD unless otherwise noted.)
- Record $413 Bn invested in actively managed ETFs and ETPs industry at end of August 2021.
- Assets increased 44.5% YTD in 2021 going from $285.83 Bn at end of 2020 to $413 Bn.
- Record YTD 2021 net inflows of $95.21 Bn beating prior record of $43.04 Bn gathered in YTD 2020.
- $95.21 Bn YTD net inflows are $4.10 Bn greater than the full year 2020 record net inflows $91.10 Bn.
- $143.27 Bn in net inflows gathered in the past 12 months.
- 17th month of consecutive net inflows
- Actively managed Equity ETFs and ETPs gathered a record $42.97 Bn in YTD net inflows 2021.
“At the end of August, the S&P 500 posted its 7th straight month of gains, up 3.0% in the month, benefitting from continued support from the Fed and as positive earnings. Developed ex-U.S. markets gained 1.8% in August as most countries advanced, while Korea (down 1.3%) and Hong Kong (down 0.9%) declined the most, due in part to concerns of the new announced regulatory requirements set to take effect in China. Emerging markets were up 3.0% with Thailand (up 10.8%) and the Philippines (up 10.4%) leading the gains at the end of August.” According to Deborah Fuhr, managing partner, founder and owner of ETFGI.
Growth in actively managed ETF and ETP assets as of the end of August 2021

The Global active ETFs and ETPs industry had 1,264 products, with 1,557 listings, assets of US$413 Bn, from 241 providers listed on 28 exchanges in 21 countries at the end oif August.
Equity focused actively managed ETFs/ETPs listed globally gathered net inflows of $2.73 Bn over August, bringing net inflows for the year to August 2021 to $42.97 Bn, more than the $14.57 Bn in net inflows equity products had attracted for the year to August 2020. Fixed Income focused actively managed ETFs/ETPs listed globally attracted net inflows of $3.84 Bn during August, bringing net inflows for the year to August 2021 to $41.46 Bn, much greater than the $25.49 Bn in net inflows fixed income products had attracted for the year to August 2020.
Substantial inflows can be attributed to the top 20 active ETFs/ETPs by net new assets, which collectively gathered
$4.84 Bn during August. SPDR Blackstone/GSO Senior Loan ETF (SRLN US) gathered $781 Mn the largest net inflows.
Top 20 actively managed ETFs/ETPs by net new assets August 2021
|
Name |
Ticker |
Assets |
NNA |
NNA |
|
SPDR Blackstone/GSO Senior Loan ETF |
SRLN US |
7,324.70 |
5,077.09 |
780.81 |
|
Magellan High Conviction Trust/ETF |
MHHT AU |
763.86 |
763.86 |
763.86 |
|
JPMorgan Equity Premium Income ETF |
JEPI US |
3,424.95 |
3,088.81 |
645.02 |
|
Hwabao WP Cash Tianyi Listed Money Market Fund |
511990 CH |
28,083.30 |
10,119.99 |
462.06 |
|
Vanguard Ultra Short-Term Bond ETF |
VUSB US |
1,515.83 |
1,514.62 |
237.94 |
|
JPMorgan Ultra-Short Income ETF |
JPST US |
17,737.73 |
2,138.18 |
225.58 |
|
PGIM Ultra Short Bond ETF |
PULS US |
1,876.46 |
659.29 |
212.44 |
|
JPMorgan Ultra-Short Municipal Income ETF |
JMST US |
2,110.96 |
961.90 |
173.59 |
|
Lyxor Smart Overnight Return - UCITS ETF - C-EUR - Acc |
CSH2 FP |
857.24 |
(46.27) |
165.11 |
|
First Trust Preferred Securities and Income Fund |
FPE US |
7,524.23 |
1,502.86 |
163.83 |
|
CI First Asset Global Financial Sector ETF |
FSF CN |
813.48 |
260.80 |
127.93 |
|
Blackrock Short Maturity Bond ETF |
NEAR US |
4,779.88 |
228.42 |
117.83 |
|
First Trust Senior Loan ETF |
FTSL US |
2,600.74 |
1,277.45 |
107.41 |
|
Hyperion Global Growth Companies Fund Manage Fund |
HYGG AU |
1,430.37 |
1,254.41 |
107.19 |
|
Dimensional US Core Equity 2 ETF |
DFAC US |
14,002.57 |
256.04 |
106.47 |
|
Innovator U.S. Equity Power Buffer ETF - August |
PAUG US |
182.50 |
62.31 |
105.90 |
|
Nationwide Risk-Managed Income ETF |
NUSI US |
582.30 |
404.31 |
100.01 |
|
Dimensional US Targeted Value ETF |
DFAT US |
6,138.21 |
188.19 |
82.25 |
|
PIMCO Short Term Municipal Bond Strategy Fund |
SMMU US |
545.88 |
259.65 |
79.75 |
|
USAA Core Intermediate-Term Bond ETF |
UITB US |
1,031.99 |
389.89 |
78.38 |

Investors have tended to invest in Fixed Income actively managed ETFs and ETPs during August.


