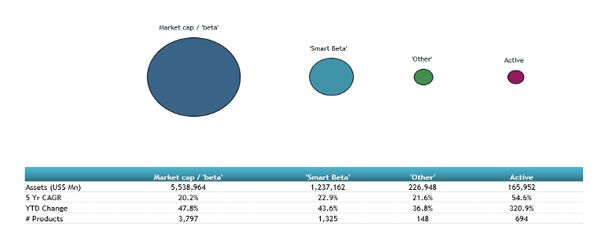
ETFGI, a leading independent research and consultancy firm covering trends in the global ETFs/ETPs ecosystem, reports record assets and net inflows for Smart Beta ETFs and ETPs listed in globally of US$1.24 trillion and US$102.03 billion respectively at the end H1 2021. Smart Beta ETFs and ETPs providing equity exposure listed globally gathered net inflows of US$14.27 billion during June, bringing year-to-date net inflows to a record US$102.03 billion which is higher than the US$12.36 billion gathered at this point last year. Year-to-date through the end of June 2021, Smart Beta Equity ETF/ETP assets have increased by 23.8% from US$999 billion to US$1.24 trillion, with a 5-year CAGR of 22.8%, according to ETFGI’s June 2021 ETF and ETP Smart Beta industry landscape insights report, a monthly report which is part of an annual paid-for research subscription service. (All dollar vales in USD unless otherwise noted.)
Highlights
- Record $1.24 Tn invested in Smart Beta ETFs and ETPs industry at end of H1 2021.
- Assets have increased 23.8% in H1 going from $999 Bn at end of 2020 to $1.24 Tn.
- Record H1 net inflows of $102.03 Bn beating prior record of $44.77 Bn gathered in H1 2015.
- $102.03 Bn H1 net inflows are $49.71 Bn greater than the full year 2020 record net inflows $52.32 Bn.
- $142.72 Bn in net inflows gathered in the past 12 months.
- 11th month of consecutive net inflows
- Equity Smart Beta ETFs and ETPs listed gathered a record $102.03 Bn in net inflows in H1 2021.
“The S&P 500 gained 2.33% in June and are up 15.25% in the first half of 2021. Developed markets ex-U.S. lost 0.82% in June but are up 9.96% in the first half. Emerging markets are up 0.47% in June and are up 9.03% in the first half. According to Deborah Fuhr, managing partner, founder and owner of ETFGI.
At the end of June 2021, there were 1,325 smart beta equity ETFs/ETPs, with 2,634 listings, assets of $1.24 Tn, from 194 providers listed on 45 exchanges in 37 countries.
Comparison of assets in market cap, smart beta, other and active equity products

Following net inflows of $14.27 Bn and market moves during the month, assets invested in Smart Beta ETFs/ETPs listed globally increased by 1.64%, from $1.22 Tn at the end of May 2021 to $1.24 Tn. Fundamental ETFs and ETPs attracted the greatest monthly net inflows, gathering $10.16 Bn during June. Volatility ETFs and ETPs suffered the largest net outflows during the month at $433 Mn.
Substantial inflows can be attributed to the top 20 Smart Beta ETFs/ETPs by net new assets, which collectively gathered $11.60 Bn during June. Vanguard Value ETF (VTV US) gathered $1.25 Bn the largest net inflow.
Top 20 Smart Beta ETFs/ETPs by net new assets June 2021
|
Name |
|
Ticker |
Assets |
NNA |
NNA |
|
Vanguard Value ETF |
|
VTV US |
81,704.88 |
10,234.10 |
1,245.16 |
|
SPDR Portfolio S&P 500 Growth ETF |
|
SPYG US |
12,378.48 |
1,405.25 |
1,221.76 |
|
Schwab US Dividend Equity ETF |
|
SCHD US |
26,038.71 |
6,554.07 |
1,117.53 |
|
iShares Edge MSCI World Value Factor UCITS ETF - Acc |
|
IWVL LN |
6,789.58 |
3,008.73 |
888.92 |
|
iShares S&P Small-Cap 600 Value ETF |
|
IJS US |
10,103.53 |
1,759.36 |
797.02 |
|
Vanguard Growth ETF |
|
VUG US |
78,864.17 |
1,600.61 |
622.91 |
|
iShares Trust iShares ESG Aware MSCI USA ETF |
|
ESGU US |
18,417.78 |
2,900.00 |
616.44 |
|
iShares Edge MSCI USA Momentum Factor ETF |
|
MTUM US |
15,305.22 |
1,121.41 |
521.02 |
|
iShares MSCI EAFE Value ETF |
|
EFV US |
14,368.53 |
6,327.90 |
493.18 |
|
iShares Edge MSCI USA Quality Factor ETF |
|
QUAL US |
21,575.91 |
2,744.46 |
467.48 |
|
Invesco DWA Momentum ETF |
|
PDP US |
2,170.35 |
105.48 |
407.00 |
|
iShares Edge MSCI International Value Factor ETF |
|
IVLU US |
1,336.07 |
706.78 |
404.47 |
|
iShares Core Dividend Growth ETF |
|
DGRO US |
19,207.03 |
2,531.45 |
387.81 |
|
iShares ESG MSCI EM ETF |
|
ESGE US |
7,991.97 |
1,384.70 |
373.97 |
|
iShares Edge MSCI Europe Value Factor UCITS ETF |
|
IEFV LN |
3,938.81 |
1,723.02 |
368.04 |
|
First Trust Rising Dividend Achievers ETF |
|
RDVY US |
4,781.71 |
2,416.12 |
363.72 |
|
Goldman Sachs ActiveBeta U.S. Large Cap Equity ETF |
|
GSLC US |
13,104.74 |
75.15 |
352.68 |
|
BMO Equal Weight Banks Index ETF |
|
ZEB CN |
1,651.23 |
245.17 |
331.06 |
|
Vanguard Small-Cap Value ETF |
|
VBR US |
24,590.70 |
2,585.94 |
313.67 |
|
SPDR Portfolio S&P 500 High Dividend ETF |
|
SPYD US |
4,666.57 |
1,789.30 |
304.44 |


