


ETFGI, reported today that assets invested in the ETFs industry reached a New Milestone: ETF Assets Surge to Record US$21.91 Trillion Worldwide globally. During April, the ETFs industry globally gathered net inflows of US$218.97 billion, bringing year-to-date net inflows to a record US$856.38 billion, according to ETFGI's April 2026 Global ETFs and ETPs industry landscape insights report, the monthly report which is part of an annual paid-for research subscription service. ETFGI, is a 14 year old leading independent research and consultancy firm renowned for its expertise in subscription research, consulting services, 6 annual ETFGI Global ETFs Insights Summits, and ETF TV on global ETF industry trends. (All dollar values in USD unless otherwise noted)
Highlights
- Global ETF assets reached a record $21.91 trillion at end-April 2026, surpassing the prior high of $21.24 trillion (February 2026).
- Assets are up 10.5% year-to-date, from $19.84 trillion at end-2025.
- ETFs gathered $218.97 billion in net inflows in April alone.
- Record YTD inflows of $856.38 billion significantly exceed prior highs of $620.54 billion (2025) and $467.69 billion (2024).
- The industry has now seen 83 consecutive months of net inflows.
- iShares is the largest provider in terms of assets with $6.06 Tn, reflecting 27.7% market share; Vanguard is second with $4.69 Tn and 21.4% market share, followed by State Street SPDR ETFs with $2.16 Tn and 9.9% market share. The top three ETF providers, out of 1004, account for 59.0% of Global ETF AUM, while the remaining 1001 providers each have less than 5% market share.
“The S&P 500 rose 10.49% in April and is up 5.70% year-to-date in 2026. Developed markets outside the U.S. gained 9.44% in April, bringing their year-to-date return to 9.63%. Within developed markets, Korea (+38.29%) and Luxembourg (+14.27%) posted the strongest gains in April. Emerging markets advanced 10.53% during the month and are up 7.39% year-to-date, with Taiwan (+26.59%) and Egypt (+21.84%) leading performance.”— Deborah Fuhr, Managing Partner, Founder, and Owner of ETFGI
Growth in assets in the Global ETFs industry as of the end of April
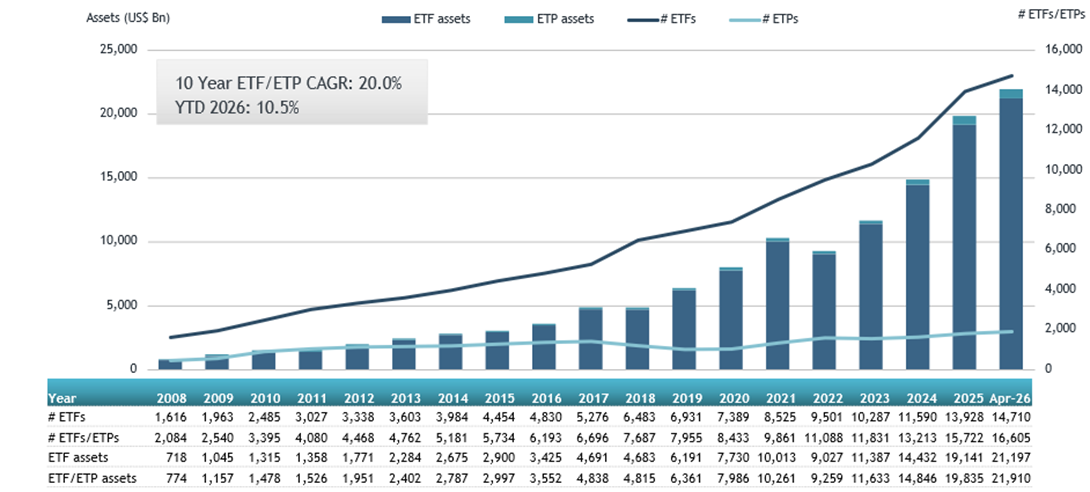
Source: ETFGI data sourced from ETF/ETP sponsors, exchanges, regulatory filings, Thomson Reuters/Lipper, Bloomberg, publicly available sources and data generated in-house. Note: “ETFs” are typically open-end index funds that provide daily portfolio transparency, are listed and traded on exchanges like stocks on a secondary basis as well as utilising a unique creation and redemption process for primary transactions. “ETPs” refers to other products that have similarities to ETFs in the way they trade and settle but they do not use a mutual fund structure. The use of other structures including grantor trusts, partnerships, notes and depositary receipts by ETPs can create different tax and regulatory implications for investors when compared to ETFs which are funds.
The Global ETF industry had 16,605 ETFs, with 32,401 listings, assets of US$21.91 Tn, from 1,004 providers listed on 86 exchanges in 66 countries.
ETF Providers
As of the end of April 2026, the global ETF industry remains highly concentrated among a small number of dominant providers, with iShares by BlackRock leading at $6.06 trillion in assets (27.7% market share), followed by Vanguard at $4.69 trillion (21.4%) and State Street Investment Management SPDR ETFs at $2.16 trillion (9.9%). Together, these three firms account for a significant 59.0% of total global ETF assets, underscoring the scale advantage and entrenched leadership at the top of the market, despite the presence of 1,004 providers globally.
Recent flow data underscores intensifying competitive dynamics among leading ETF providers. Vanguard, with 229 ETFs, led April net inflows at $60.4 billion and $209.1 billion year-to-date, narrowly outpacing iShares, which—with 1,299 ETFs—gathered $50.4 billion in April and $194.6 billion year-to-date. State Street, with 329 ETFs, attracted $32.1 billion in April and $57.3 billion year-to-date.
While iShares continues to lead in total assets, Vanguard’s sustained momentum flows into a much smaller number of ETFs highlights a broader industry shift, as investors increasingly favor low-cost, scalable ETF solutions.
New Inflows
During April, ETFs gathered net inflows of $218.97 billion, bringing year-to-date net inflows to a record $856.38 billion. Equity ETFs led flows, attracting $124.75 billion, bringing year-to-date (YTD) inflows to $362.37 billion—well above the $297.48 billion recorded by April 2025. Fixed income ETFs recorded net inflows of $37.02 billion in April, lifting YTD inflows to $156.19 billion, also exceeding the $98.19 billion reported over the same period last year.
Commodities ETFs saw net inflows of $4.21 billion during the month, bringing YTD inflows to $20.84 billion, below the $32.41 billion recorded by April 2025. Meanwhile, active ETFs continued to see strong demand, gathering $67.02 billion in April and reaching $311.66 billion in YTD inflows—significantly higher than the $176.44 billion recorded in April 2025.
Substantial inflows can be attributed to the top 20 ETF's by net new assets, which collectively gathered $107.94 Bn in April, the Vanguard S&P 500 ETF (VOO US) gathered $25.31 Bn alone.
Top 20 ETFs by net new assets April 2026: Global
Source: ETFGI data sourced from ETF/ETP sponsors, exchanges, regulatory filings, Thomson Reuters/Lipper, Bloomberg, publicly available sources and data generated in-house. Note: This report is based on the most recent data available at the time of publication. Asset and flow data may change slightly as additional data becomes available.
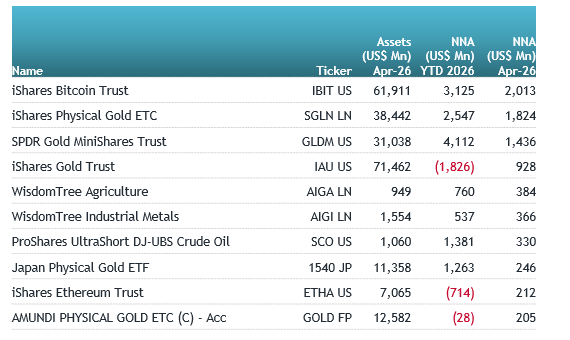
Substantial inflows can be attributed to the top 10 ETP's by net new assets, which collectively gathered $7.94 Bn in April, the iShares Bitcoin Trust (IBIT US) gathered $2.01 Bn alone.
Top 20 ETPs by net new assets April 2026: Global

Source: ETFGI data sourced from ETF/ETP sponsors, exchanges, regulatory filings, Thomson Reuters/Lipper, Bloomberg, publicly available sources and data generated in-house. Note: This report is based on the most recent data available at the time of publication. Asset and flow data may change slightly as additional data becomes available.
Investors have tended to invest in Equity ETFs during April.
