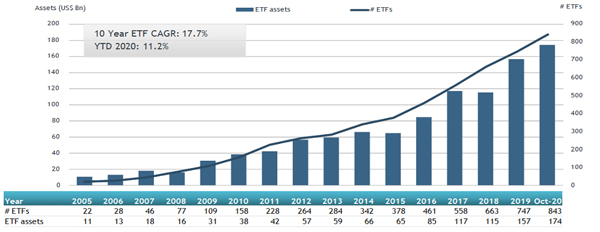
ETFGI, a leading independent research and consultancy firm covering trends in the global ETFs and ETPs ecosystem, reported today that ETFs listed in Canada gathered net inflows of US$1.34 billion during October, bringing year-to-date net inflows to a record US$25.98 billion which is significantly above the 2019 YTD and full year 2019 inflows of US$14.16 billion and US$20.93 billion respectively. During October, Canadian ETF assets decreased by 1.2%, from US$176.27 billion at the end of September to US$174.12 billion, according to ETFGI's October 2020 Canadian ETFs and ETPs industry landscape insights report, the monthly report which is part of an annual paid-for research subscription service. (All dollar values in USD unless otherwise noted.)
Highlights
- year-to-date net inflows are a record $25.98 billion, significantly above the 2019 YTD and full year 2019 inflows of $14.16 billion and $20.93 billion respectively.
- Canada celebrates the 20th anniversary of the listing of the world's first ever fixed income ETFs on November 22nd.
- Assets of $174.12 billion invested in ETFs and ETPs listed in Canada at the end of October are the 3rd highest on record.
“During October, the S&P 500 decreased by 2.66% due to the uncertainty of US elections and rise in virus infections. Developed markets outside the US fell 3.56% during October, 21 of 24 countries lost ground as a large portion of Europe announced new lockdown plans. Emerging markets reported positive a return of 2.04% in October.” According to Deborah Fuhr, managing partner, founder and owner of ETFGI.
Growth in Canadian ETF and ETP assets as of the end of October 2020

Canada celebrate the 20th anniversary of the listing of the world's first ever fixed income ETFs November 22nd. The first fixed income ETFs were a five-year Government of Canada bond (ticker XGV) and a ten-year bond (ticker XGX). These bond ETFs were merged into the iShares Core Canadian Universe bond ETF (ticker XBB) The Canadian ETF industry had 843 ETFs, with 1,024 listings, assets of $174.12 Bn, from 38 providers listed on 2 exchanges at the end of October.
Equity ETFs/ETPs gathered net inflows of $609 million during October, bringing net inflows YTD 2020 to $12.46 billion, which is much higher than the $2.75 billion in net inflows equity products had gathered YTD in 2019. Fixed income ETFs/ETPs had net inflows of $113 million during October, bringing net inflows for the year to October 2020 to $4.07 billion, higher than the $3.59 billion in net inflows fixed income products had attracted by the end of October 2019. Commodity ETFs/ETPs accumulated net inflows of $19 Mn in October. Year to date, net inflows are at $578 Mn, compared to net inflows of $75 Mn over the same period last year. Active ETFs/ETPs attracted net inflows of $522 million over the month, gathering net inflows for the year in Canada of $8.36 billion, greater than the $7.43 billion in net inflows active products had reported for the year to October 2019.
Substantial inflows can be attributed to the top 20 ETFs by net new assets, which collectively gathered $1.82 billion during October. Horizons Emerging Markets Equity Index ETF - Acc (HXEM CN) gathered $345.51 million alone.
Top 20 ETFs by net new assets October 2020: Canada
|
Name |
Ticker |
Assets |
NNA |
NNA |
|
HXEM CN |
345.25 |
355.63 |
345.51 |
|
|
TD Q Canadian Dividend ETF |
TQCD CN |
209.98 |
221.04 |
213.71 |
|
Horizons International Developed Markets Equity Index ETF |
HXDM CN |
416.86 |
340.30 |
186.79 |
|
Horizons Cdn Select Universe Bond ETF |
HBB CN |
1,457.21 |
1,068.67 |
136.63 |
|
BMO Aggregate Bond Index ETF |
ZAG CN |
3,850.11 |
(203.70) |
118.57 |
|
TD Global Technology Leaders Index ETF |
TEC CN |
310.26 |
248.64 |
102.59 |
|
WisdomTree U.S. Quality Dividend Growth Index Unit ETF |
DGR/B CN |
115.81 |
59.91 |
91.69 |
|
Horizons Cash Maximizer ETF - Acc |
HSAV CN |
549.41 |
542.26 |
81.79 |
|
BMO Long Federal Bond Index ETF |
ZFL CN |
1,700.75 |
422.33 |
78.49 |
|
CI High Interest Savings Fund |
CSAV CN |
1,986.56 |
893.75 |
56.90 |
|
TD Active Global Infrastructure Equity ETF |
TINF CN |
49.34 |
51.79 |
49.52 |
|
Mackenzie Canadian Short-Term Bond Index ETF |
QSB CN |
210.30 |
204.27 |
49.11 |
|
Fidelity International High Quality Index ETF |
FCIQ CN |
218.03 |
171.79 |
47.65 |
|
iShares Core Canadian Short Term Bond Index ETF |
XSB CN |
1,898.29 |
158.71 |
40.58 |
|
iShares NASDAQ 100 Index Fund (CAD-Hedged) |
XQQ CN |
807.31 |
230.78 |
40.58 |
|
BMO High Yield US Corporate Bond Hedged to CAD Index ETF |
ZHY CN |
532.55 |
46.43 |
39.43 |
|
Vanguard S&P 500 Index ETF |
VFV CN |
2,426.10 |
327.04 |
39.28 |
|
Manulife Multifactor Canadian Smid Cap Index Etf |
MCSM CN |
74.37 |
73.96 |
35.38 |
|
Emerge ARK Global Disruptive Innovation ETF - Acc |
EARK CN |
30.81 |
33.31 |
33.31 |
|
Vanguard Growth ETF Portfolio |
VGRO CN |
1,122.58 |
340.79 |
32.88 |

Investors have tended to invest in Equity ETFs during October.


