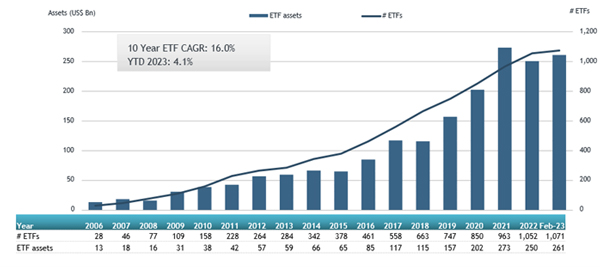
ETFGI, a leading independent research and consultancy firm covering trends in the global ETFs ecosystem, report the ETFs industry in Canada celebrates the 33rd anniversary of the listing of the first ETF on March 9th. During February the ETFs industry in Canada gathered net inflows of US$3.50 billion, bringing year-to-date net inflows to US$3.56 billion. During the month, Canadian ETF assets decreased by 3.2%, from US$269 billion at the end of January to US$261 billion, according to ETFGI's February 2023 Canadian ETFs and ETPs industry landscape insights report, the monthly report which is part of an annual paid-for research subscription service. (All dollar values in USD unless otherwise noted.)
Highlights
- ETFs industry in Canada celebrates the 33rd anniversary of the listing of the first ETF on March 9th.
- Net inflows of $3.50 Bn in February 2023.
- Net inflows of $3.56 Bn during 2023 are the second highest on record, after YTD net inflows of $4.39 Bn in 2022.
- 8th month of net inflows.
- Assets of $261 Bn invested in ETFs listed in Canada at the end of February 2023.
- Assets have increased 4.1 % YTD in 2023, going from $250 Bn at the end of 2022, to $261 Bn.
“The S&P 500 decreased by 2.44 % in February but is up by 3.69% in first 2 months of 2023. Developed markets excluding the US decreased by 2.59% in February but are up 5.47% in the first 2 months of 2023. Israel (down 6.97%) and Hong Kong (down 6.94%) saw the largest decreases amongst the developed markets in February. Emerging markets decreased by 5.57% during February but are up 0.72% YTD in 2023. Colombia (down 11.62%) and Thailand (down 9.38%) saw the largest decreases amongst emerging markets in February.” According to Deborah Fuhr, managing partner, founder and owner of ETFGI.
Growth in Canadian ETF assets as of the end of February 2023

The ETFs industry in Canadian had 1,071 ETFs, with 1,364 listings, assets of $261 Bn, from 42 providers listed on 2 exchanges at the end of February.
During February, ETFs gathered net inflows of $3.50 Bn. Equity ETFs reported net inflows of $390 Mn during February, bringing YTD net outflows to $147 Mn, much lower than the $3.49 Bn in net inflows equity products had attracted YTD in 2022. Fixed income ETFs gathered net inflows of $1.10 Bn during February, bringing net inflows YTD 2023 to $688 Mn, higher than the $68 Mn in net inflows fixed income products gathered YTD in 2022. Active ETFs attracted net inflows of $1.97 Bn during the month, gathering YTD net inflows of $2.82 Bn, higher than the $904 Mn in net inflows active products had reported YTD in 2022.
Substantial inflows can be attributed to the top 20 ETFs by net new assets, which collectively gathered $2.88 Bn during February. CI High Interest Savings ETF (CSAV CN) gathered $452.08 Mn, the largest individual net inflow.
Top 20 ETFs by net new assets February 2023: Canada
|
Name |
Ticker |
Assets |
NNA |
NNA |
|
CSAV CN |
4,719.41 |
841.88 |
452.08 |
|
|
iShares S&P/TSX 60 Index Fund |
XIU CN |
8,182.09 |
154.42 |
339.28 |
|
Horizons High Interest Savings ETF |
CASH CN |
1,486.39 |
439.11 |
307.60 |
|
BMO High Yield US Corporate Bond Index ETF |
ZJK CN |
875.07 |
340.25 |
163.35 |
|
BMO High Yield US Corporate Bond Hedged to CAD Index ETF |
ZHY CN |
809.86 |
333.38 |
158.93 |
|
BMO MSCI EAFE Index ETF |
ZEA CN |
4,468.82 |
278.47 |
157.49 |
|
TD S&P/TSX Capped Composite Index ETF |
TTP CN |
896.24 |
157.28 |
136.46 |
|
iShares Core Canadian Universe Bond Index ETF |
XBB CN |
3,433.57 |
-141.78 |
135.43 |
|
BMO Mid-Term US IG Corporate Bond Index ETF |
ZIC CN |
2,079.88 |
176.42 |
118.82 |
|
BMO US Aggregate Bond Index ETF |
ZUAG CN |
124.72 |
129.68 |
111.54 |
|
Invesco 1-3 Year Laddered Floating Rate Note Index ETF |
PFL CN |
436.59 |
143.71 |
108.86 |
|
iShares ESG Aware MSCI USA Index ETF |
XSUS CN |
278.00 |
114.54 |
96.13 |
|
BMO Mid-Term US IG Corporate Bond Hedged to CAD Index ETF |
ZMU CN |
1,956.31 |
137.03 |
93.23 |
|
CI Alternative Investment Grade Credit Fund |
CRED CN |
165.49 |
135.52 |
84.59 |
|
iShares S&P/TSX Capped Materials Index Fund |
XMA CN |
195.09 |
87.54 |
76.05 |
|
Vanguard Canadian Aggregate Bond Index ETF |
VAB CN |
2,924.86 |
62.60 |
74.25 |
|
Vanguard FTSE Canadian High Dividend Yield Index ETF |
VDY CN |
1,470.93 |
63.62 |
68.27 |
|
iShares Floating Rate Index ETF |
XFR CN |
443.15 |
69.06 |
66.10 |
|
NBI Unconstrained Fixed Income ETF |
NUBF CN |
1,635.36 |
151.36 |
65.61 |
|
Hamilton Canadian Financials Yield Maximizer ETF |
HMAX CN |
99.90 |
102.35 |
64.46 |
Investors have tended to invest in Active ETFs during February.


