ETFGI, a leading independent research and consultancy firm on trends in the global ETF/ETP ecosystem, reported today that US listed ETFs and ETPs saw net outflows of US$1.49 billion during June 2018. This is the third time during 2018 that US listed ETFs/ETPs have seen net outflows, following February and March. (All dollar values in USD unless otherwise noted.)
Highlights
- ETFs and ETPs listed in the US saw net outflows of $1.49 Bn during June 2018, marking the 3rd month with net outflows this year.
- Equity products experienced the largest net outflows during June with $6.58 Bn, while Fixed Income ETFs/ETPs gathered the largest net inflows with $6.46 Bn.
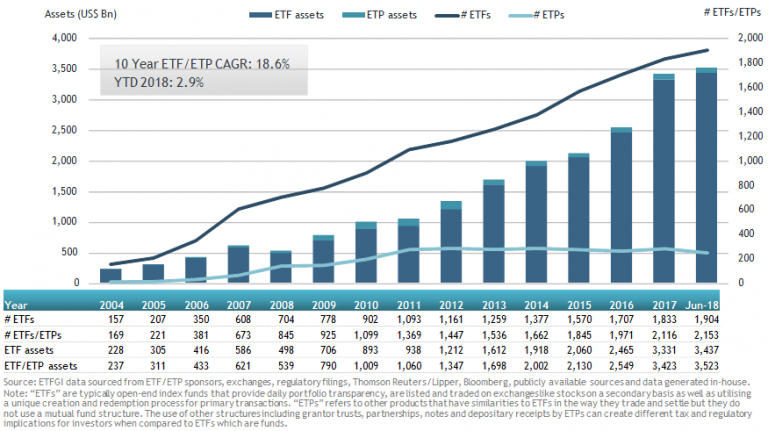
- ETF/ETP assets have decreased by 0.84% during June to $3.52 Tn.
The S&P 500 was up 0.62% in June and 2.65% in the first half of 2018. International markets (developed ex US) and Emerging markets posted losses during June and during the first half of 2018, down 1.48% and 3.40% in June and 2.45% and 6.05% in the first half, respectively, driven by a strong dollar, trade concerns, and rising interest rates.
According to ETFGI’s June 2018 US ETF and ETP industry insights report, an annual paid-for research subscription service, fixed income ETFs/ETPs gathered the largest net inflows during June with $6.46 Bn, while equity ETFs/ETPs experienced the largest net outflows with $6.58 Bn.
Monthly outflows were greatest for those products providing exposure to Emerging Markets equities, such as the iShares MSCI Emerging Markets ETF with outflows of $5.37 Bn, followed by products with US equities exposure, such as the SPDR S&P 500 ETF and the iShares Core S&P 500 ETF, with $4.69 Bn and $3.39 Bn respectively.
Year-to-date through end of June, ETFs/ETPs listed in the US have seen net inflows of $123.31 Bn. Equity products gathered the largest net inflows year-to-date with $71.02 Bn, while Leveraged ETFs/ETPs experienced the largest net outflows with $1.62 Bn.
US ETF and ETP asset growth as at end of June 2018

At the end of June 2018, the US ETF/ETP industry had 2,153 ETFs/ETPs, assets of $3.52 Tn, from 139 providers on 3 exchanges. ETF/ETP assets have decreased by 0.84% from $3.55 Tn at the end of May, and by 2.93% year-to-date from $3.42 Tn at the end of 2017.
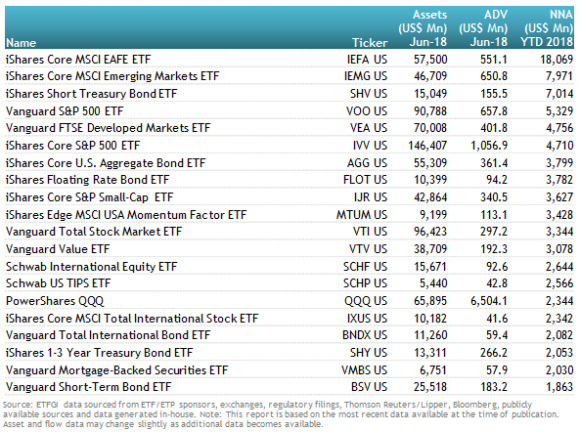
Investors have tended to invest in core, market cap and lower cost ETFs during 2018, with the iShares Core MSCI EAFE ETF (IEFA US) and the iShares Core MSCI Emerging Markets ETF (IEMG US) capturing flows of $18.07 Bn and $7.97 Bn, respectively. A high proportion of net inflows year-to-date can be attributed to the top 20 ETFs by net new assets, which collectively gathered $86.83 Bn.
Top 20 ETFs by YTD net inflows: US

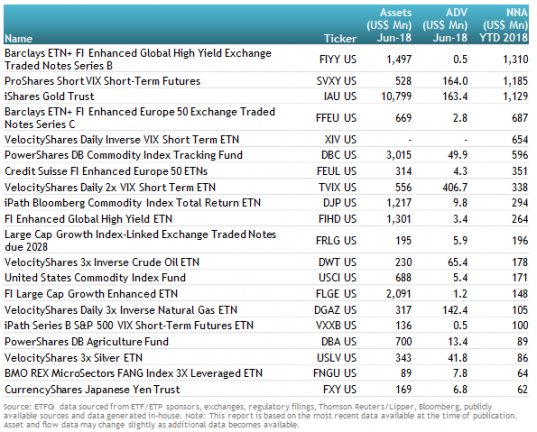
Similarly, the top 20 ETPs by net new assets collectively gathered $8.01 Bn year-to-date during 2018.
Top 20 ETPs by YTD net inflows: US


