


.jpg)
ETFGI, a leading independent research and consultancy firm covering trends in the global ETF/ETP ecosystem, reported today that ETFs and ETPs listed in Europe gathered net inflows of US$US$9.79 billion in January. Assets invested in the European ETF/ETP industry finished the month up 6.83%, from US$767.78 billion at the end of December, to US$820.23 billion, according to ETFGI's January 2019 European ETF and ETP industry landscape insights report, an annual paid-for research subscription service. (All dollar values in USD unless otherwise noted.)
Highlights
- Assets invested in the European ETF/ETP industry rise 6.83% in January.
- During January 2019, ETFs/ETPs listed in Europe attracted US$9.79 Bn in net inflows.
- 52nd consecutive month of net inflows into ETFs/ETPs listed in Europe.
“In January, equity markets rebounded from Q4 when global equities suffered steep declines amid persistent worries over trade and economic growth. Fed chair Powell revised his stance on where he believes the neutral rate of interest lies, easing fears of a dramatic and painful tightening cycle. Energy’s decline during the Q4 rout subdued inflation in developed economies taking hiking pressure off central banks while provided stimulus to consumers and businesses, giving stronger core metrics. The S&P 500 finished January up 8.01%, the best January since 1987, while the S&P Topix 150 gained 7.26% and the S&P Europe 350 gained 6.23%. Emerging and Frontier markets were up 7.77% and 4.61% respectively, hampered by dollar strength.” according to Deborah Fuhr, managing partner and founder of ETFGI.
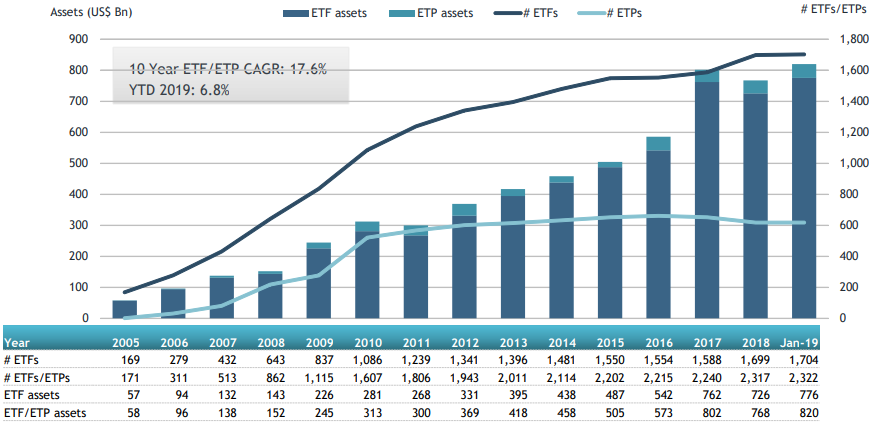
At the end of January 2019, the European ETF/ETP industry had 2,322 ETFs/ETPs, from 70 providers listed on 28 exchanges. Following net inflows of $9.79 Bn and market moves during the month, assets invested in the European ETF/ETP industry increased by 6.83% from $767.78 Bn at the end of December, to $820.23 Bn.
Growth in European ETF and ETP assets as of the end of January 2019

Equity ETFs/ETPs listed in Europe attracted net inflows of $1.91 Bn in January, bringing net inflows for 2019 to $1.91 Bn, less than the $13.98 Bn in net inflows equity products had attracted by the end of January 2018. Fixed income ETFs/ETPs listed in Europe attracted net inflows of $6.82 Bn in January, bringing net inflows for 2019 to $6.82 Bn, considerably greater than the $1.73 Bn in net inflows fixed income products had attracted by the end of January 2018.
Substantial inflows can be attributed to the top 20 ETFs/ETPs's by net new assets, which collectively gathered $8.50 Bn in January, the PIMCO US Dollar Short Maturity ETF (MINT LN) gathered $735.99 Mn alone.
Top 20 ETFs/ETPs by net new assets January 2019: Europe
|
Name |
Ticker |
Assets |
NNA |
NNA |
|
PIMCO US Dollar Short Maturity ETF |
MINT LN |
3,153 |
736 |
736 |
|
iShares J.P. Morgan EM Local Govt Bond UCITS ETF |
SEML LN |
7,639 |
693 |
693 |
|
iShares J.P. Morgan $ EM Bond UCITS ETF |
SEMB LN |
7,224 |
662 |
662 |
|
iShares J.P. Morgan $ EM Bond UCITS ETF |
JPEA LN |
978 |
600 |
600 |
|
iShares Core MSCI EM IMI UCITS ETF |
EMIM LN |
11,909 |
597 |
597 |
|
UBS ETF-MSCI Japan UCITS ETF (JPY) - Acc |
JPNA SW |
913 |
574 |
574 |
|
iShares Core FTSE 100 UCITS ETF |
ISF LN |
7,870 |
453 |
453 |
|
iShares Edge MSCI EM Minimum Volatility UCITS ETF |
EMMV LN |
1,063 |
420 |
420 |
|
ETFS Physical Gold |
PHAU LN |
7,292 |
406 |
406 |
|
Invesco US Treasury 7-10 Year UCITS ETF GBP Hdg Dist |
TRXS LN |
396 |
390 |
390 |
|
XACT Nordic High Dividend Low Volatility UCITS ETF |
XACTHDIV SS |
713 |
382 |
382 |
|
Xetra Gold EUR |
4GLD GY |
8,050 |
337 |
337 |
|
iShares € Ultrashort Bond UCITS ETF |
ERNE LN |
3,061 |
316 |
316 |
|
Xtrackers II USD Emerging Markets Bond UCITS ETF |
XUEM GY |
763 |
316 |
316 |
|
iShares Core € Corp Bond UCITS ETF |
IEBC LN |
8,805 |
303 |
303 |
|
Xtrackers II Eurozone Government Bond UCITS ETF DR |
XGLE GY |
3,139 |
280 |
280 |
|
Invesco S&P 500 ETF |
SPXS LN |
4,268 |
272 |
272 |
|
iShares Global Govt Bond UCITS ETF |
SGLO LN |
1,221 |
268 |
268 |
|
Xtrackers MSCI USA Financials Index UCITS ETF DR |
XUFN GY |
259 |
248 |
248 |
|
AMUNDI ETF MSCI Emerging Markets - B |
AUEM FP |
2,931 |
246 |
246 |

Investors tended to invest in international Fixed income products.
Investors tended to invest in international Fixed income products.


