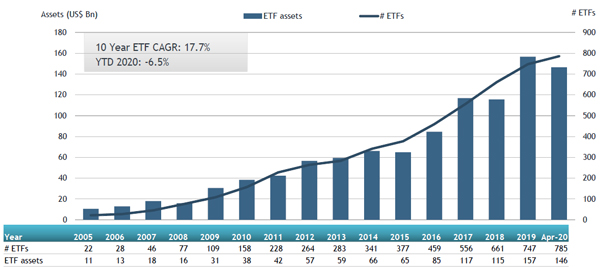
ETFGI, a leading independent research and consultancy firm covering trends in the global ETFs/ETPs ecosystem, reported today that ETFs listed in Canada gathered US$455 million in net inflows during April, bringing year-to-date net inflows to US$12.57 billion which is significantly more than the US$4.50 billion gathered year-to-date in 2019. In the month, Canadian ETF assets increased by 1.5%, from US$144.18 billion at the end of March to US$146.39 billion. At the end of April 2020, the Canadian ETFs/ETPs industry had 785 ETFs/ETPs, with 951 listings, from 40 providers on 2 exchanges according to ETFGI's April 2020 Canada ETFs and ETPs industry landscape insights report, an annual paid-for research subscription service. (All dollar values in USD unless otherwise noted).
Highlights
- Canadian ETFs/ETPs assets at $146.39 billion at the end of April are the 5th highest on record.
- Equity ETFs/ETPs gathered net inflows of $243 Mn while Fixed income ETFs and ETPs experienced net outflows of $409 Mn in April
- At the end of April, the YTD inflows of $12.57 billion are much higher than $4.50 billion gathered
by this point in 2019.
“During April, driven by fiscal stimulus and the apparent slowing of the spread of COVID-19 despite the S&P 500 gained 12.8%, the biggest monthly gain in 33 years, with information technology stocks showing the largest gains. Outside the US, International markets also recovered, with the S&P Developed Ex-U.S. BMI and S&P Emerging BMI up 8% and 10%, respectively.” According to Deborah Fuhr, managing partner, founder and owner of ETFGI.
Growth in Canadian ETF and ETP assets as of the end of April 2020

ETFs and ETPs listed in Canada gathered net inflows of $455 Mn in April. Year to date, net inflows stand at $12.57 Bn which is significantly more than the net inflows of $4.50 Bn gathered at this point in 2019.
Equity ETFs/ETPs gathered net inflows of $243 Mn in April, bringing year to date net inflows to $7.01 Bn, which is greater than the net inflows of $769 Mn over the same period last year. Fixed income ETFs and ETPs experienced net outflows of $409 Mn in April, reducing year to date net inflows to $1.26 Bn, which is slightly more than the same period last year which saw net inflows of $1.11 Bn. Commodity ETFs/ETPs accumulated net inflows of $117 Mn in April taking year to date, net inflows to $207 Mn, compared to net inflows of $1 Mn over the same period last year.
Active ETFs/ETPs gathered net inflows of $373 million during April, bringing year to date net inflows to $3.89 billion, which is significantly higher than the $2.57 billion in net inflows Active products had attracted at this point in 2019.
Substantial inflows can be attributed to the top 20 ETFs by net new assets NNA, which collectively gathered $1.82 billion at the end of April, BMO MSCI EAFE Index ETF (ZEA CN) gathered $332.35 million alone.
Top 20 ETFs by net new assets April 2020: Canada
|
Name |
Ticker |
Assets |
NNA |
NNA |
|
ZEA CN |
2,588.08 |
505.89 |
332.35 |
|
|
Purpose High Interest Savings ETF |
PSA CN |
1,586.77 |
(103.84) |
139.42 |
|
BMO Low Volatility Canadian Equity ETF |
ZLB CN |
1,728.04 |
249.26 |
131.57 |
|
iShares 1-10 Year Laddered Government Bond Index Fund |
CLG CN |
345.28 |
102.85 |
110.02 |
|
CI First Asset Gold Giants Covered Call ETF |
CGXF CN |
133.88 |
86.44 |
99.11 |
|
BetaPro Crude Oil 2x Daily Bull ETF - Acc |
HOU CN |
23.72 |
252.97 |
88.82 |
|
iShares S&P/TSX Global Gold Index ETF |
XGD CN |
853.26 |
87.90 |
84.25 |
|
BMO S&P 500 Index ETF |
ZSP CN |
5,432.23 |
482.62 |
83.86 |
|
BMO Ultra Short-Term Bond ETF |
ZST CN |
628.10 |
147.47 |
82.27 |
|
iShares Gold Bullion Fund - CAD Hdg |
CGL CN |
463.37 |
120.32 |
74.66 |
|
NBI Global Private Equity ETF |
NGPE CN |
75.51 |
72.04 |
71.08 |
|
iShares NASDAQ 100 Index Fund (CAD-Hedged) |
XQQ CN |
545.79 |
134.59 |
70.69 |
|
BMO Long-Term US Treasury Bond Index ETF USD |
ZTL/U CN |
77.50 |
70.87 |
69.46 |
|
Horizons Cdn Select Universe Bond ETF |
HBB CN |
1,045.01 |
734.70 |
64.44 |
|
iShares Premium Money Market Fund |
CMR CN |
345.65 |
83.49 |
60.71 |
|
BMO S&P US Mid Cap Index ETF |
ZMID CN |
63.34 |
57.90 |
56.74 |
|
Desjardins Alt Long/Short Equity Market Neutral ETF |
DANC CN |
146.49 |
36.48 |
54.53 |
|
BMO Low Volatility US Equity ETF |
ZLU CN |
1,182.99 |
93.58 |
53.29 |
|
iShares S&P/TSX Capped Energy Index ETF |
XEG CN |
432.04 |
145.88 |
48.01 |
|
BMO Nasdaq 100 Equity Hedged To CAD Index ETF |
ZQQ CN |
583.40 |
90.90 |
46.92 |

Investors have tended to invest in Active and Equity ETFs during April.


