ETFGI, a leading independent research and consultancy firm covering trends in the global ETFs/ETPs ecosystem, reported today that equity-based Smart Beta ETFs and ETPs listed globally gathered net inflows of US$3.40 billion during February bringing year-to-date net inflows to US$10.13 billion which is lower than the US$14.67 billion gathered at this point last year. Year-to-date through the end of February 2020, Smart Beta Equity ETF/ETP assets have decreased by 8.5% from US$860 billion to US$787 billion, which is the 5thhighest level of assets on record, according to ETFGI’s February 2020 ETF and ETP Smart Beta industry landscape insights report, an annual paid-for research subscription service. (All dollar values in USD unless otherwise noted.)
Highlights
- Equity Smart Beta ETFs/ETPs attracted $3.40 billion in net inflows in February
- Assets invested in Smart Beta Equity ETFs/ETPs decreased to $787 billion, but are at the 5thhighest level on record.
“At the end of February, the S&P 500 was down 8.2% as coronavirus cases continued to spread and the potential economic impact weighed on investors and the markets. Outside the U.S., the S&P Developed ex-U.S. BMI declined nearly 9.0%. The S&P Emerging BMI lost 5.1% during the month. Global equities as measured by the S&P Global BMI ended down 8.1% with 49 of 50 included country indices down, while China gained 0.9%.” According to Deborah Fuhr, managing partner, founder and owner of ETFGI.
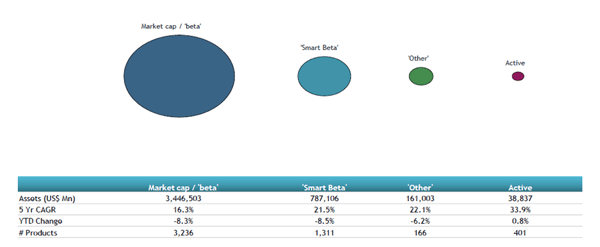
At the end of February 2020, there were 1,311 smart beta equity ETFs/ETPs, with 2,476 listings, assets of $787 billion, from 165 providers listed on 41 exchanges in 33 countries. Following net inflows of $3.40 billion and market moves during the month, assets invested in Smart Beta ETFs/ETPs listed globally decreased by 8.2%, from $857 billion at the end of January 2020 to $787 billion.
Comparison of assets in market cap, smart beta, other and active equity products

DividendsETFs and ETPs attracted the greatest monthly net inflows, gathering $1.76 billion at the end of February. Multi-Factor ETFs and ETPs suffered the greatest outflows during the month and amounted to $1.75 billion.
Substantial inflows can be attributed to the top 20 Smart Beta ETFs/ETPs by net new assets, which collectively gathered $6.74 billion at the end of February, the iShares MSCI USA Minimum Volatility ETF (USMV US) gathered $798 million alone.
Top 20 Smart Beta ETFs/ETPs by net new assets February 2020
|
Name |
Ticker |
Assets |
NNA |
NNA |
|
iShares MSCI USA Minimum Volatility ETF |
USMV US |
35,816.85 |
874.74 |
798.44 |
|
Invesco S&P 500 Low Volatility ETF |
SPLV US |
11,845.25 |
775.71 |
726.98 |
|
Vanguard Dividend Appreciation ETF |
VIG US |
39,299.46 |
571.82 |
700.08 |
|
iShares Edge MSCI USA Momentum Factor ETF |
MTUM US |
9,799.22 |
858.72 |
644.19 |
|
iShares Edge MSCI USA Quality Factor ETF |
QUAL US |
16,008.50 |
1,267.26 |
447.64 |
|
SPDR S&P Kensho New Economies Composite ETF |
KOMP US |
491.16 |
435.59 |
422.11 |
|
SPDR S&P Euro Dividend Aristocrats UCITS ETF |
SPYW GY |
2,227.86 |
390.69 |
363.57 |
|
Vanguard Value ETF |
VTV US |
49,682.85 |
678.01 |
340.18 |
|
iShares Edge MSCI World Momentum Factor UCITS ETF |
IWMO LN |
1,594.72 |
481.01 |
301.75 |
|
iShares Core Dividend Growth ETF |
DGRO US |
9,750.72 |
608.10 |
277.92 |
|
SPDR Portfolio S&P 500 Growth ETF |
SPYG US |
6,210.93 |
1,186.24 |
262.32 |
|
First Trust Value Line Dividend Index Fund |
FVD US |
9,350.44 |
725.80 |
262.24 |
|
iShares Edge MSCI Europe Minimum Volatility UCITS ETF |
MVEU LN |
1,449.32 |
206.76 |
206.32 |
|
Schwab US Dividend Equity ETF |
SCHD US |
10,690.46 |
369.85 |
171.30 |
|
iShares Edge MSCI World Minimum Volatility UCITS ETF |
MVOL LN |
4,473.48 |
688.15 |
153.24 |
|
iShares Edge MSCI Minimum Volatility EAFE ETF |
EFAV US |
12,190.70 |
201.61 |
149.22 |
|
SPDR Portfolio S&P 500 Value ETF |
SPYV US |
3,901.94 |
(584.17) |
131.85 |
|
China Southern S and P China A-share Large Cap Dividend Low Volatility 50 ETF |
515450 CH |
131.21 |
131.78 |
131.78 |
|
Vanguard Mega Cap Growth ETF |
MGK US |
5,299.15 |
319.89 |
127.92 |
|
Goldman Sachs ActiveBeta U.S. Large Cap Equity ETF |
GSLC US |
7,487.49 |
621.46 |
117.62 |


