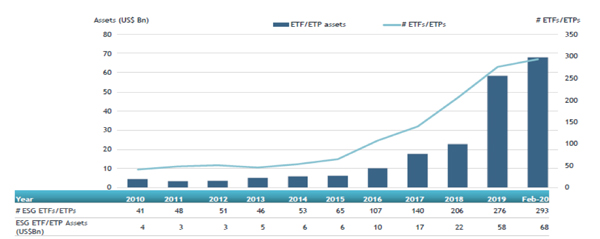
ETFGI, a leading independent research and consultancy firm covering trends in the global ETFs/ETPs ecosystem, reported today that Environmental, Social, and Governance (ESG) ETFs and ETPs listed globally gathered net inflows of US$7.54 billion during February, bringing year-to-date net inflows to US$14.30 billion which is higher than the US$2.40 billion gathered at this point last year. Total assets invested in ESG ETFs and ETPs increased by 4.93% from US$64.79 billion at the end of January 2020 to a new record US$67.99 billion, according to ETFGI’s February 2020 ETF and ETP ESG industry landscape insights report, an annual paid-for research subscription service. (All dollar values in USD unless otherwise noted.)
Highlights
- ESG ETFs and ETPs listed globally gathered $7.54 billion in net new assets at the end of February which is the 2ndhighest monthly inflow on record.
- Assets in ESG ETFs and ETPs listed globally increased by 4.93% at the end of February 2020, to a new record of $67.99 billion.
- Europe leads with the most ESG classified products available, followed by the US and APAC (ex-Japan).
“At the end of February, the S&P 500 was down 8.2% as coronavirus cases continued to spread and the potential economic impact weighed on investors and the markets. Outside the U.S., the S&P Developed ex-U.S. BMI declined nearly 9.0%. The S&P Emerging BMI lost 5.1% during the month. Global equities as measured by the S&P Global BMI ended down 8.1% with 49 of 50 included country indices down, while China gained 0.9%.” According to Deborah Fuhr, managing partner, founder and owner of ETFGI.
The Global ESG ETF/ETP industry had 293 ETFs/ETPs, with 805 listings, assets of $68 Bn, from 75 providers listed on 30 exchanges in 58 countries at the end of February. Following net inflows of $7.54 billion and market moves during the month, assets invested in ESG ETFs/ETPs listed globally increased by 4.93%, from $64.79 billion at the end of January 2020 to a record $67.99 billion.
Global ESG ETF and ETP asset growth as at end of February 2020
Since the launch of the first ESG ETF/ETP in 2002, the iShares MSCI USA ESG Select ETF, the number and diversity of products has increased steadily, with 293 ESG ETFs/ETPs and 805 listings globally at the end of February 2020. During February, 10 new ESG ETFs/ETPs were launched.
Substantial inflows can be attributed to the top 20 ETFs/ETPs by net new assets, which collectively gathered $4.92 billion at the end of February, Ping An CSI New Energy Automobile Industry ETF (515700 CH) gathered $1.08 billion alone.
Top 20 ESG ETFs/ETPs by net new assets February 2020
|
Name |
Ticker |
Assets (US$ Mn) Feb-20 |
NNA (US$ Mn) YTD-20 |
NNA (US$ Mn) Feb-20 |
|
Ping An CSI New Energy Automobile Industry ETF |
515700 CH |
1,019.77 |
1,081.01 |
1,081.01 |
|
iShares ESG MSCI EM Leaders ETF |
LDEM US |
587.76 |
637.51 |
637.51 |
|
iShares Trust iShares ESG MSCI USA ETF |
ESGU US |
3,375.62 |
2,249.22 |
292.95 |
|
iShares MSCI USA SRI UCITS ETF |
SUAS LN |
2,088.82 |
390.50 |
291.81 |
|
iShares MSCI World SRI UCITS ETF - EUR - Acc |
SUSW LN |
967.23 |
350.01 |
289.71 |
|
iShares MSCI World ESG Screened UCITS ETF Acc |
SAWD LN |
378.98 |
285.69 |
273.23 |
|
L&G US Equity Responsible Exclusions UCITS ETF |
RIUS LN |
748.15 |
233.36 |
231.25 |
|
Bosera CSI Sustainable Development 100 ETF |
515090 CH |
196.80 |
203.86 |
203.86 |
|
iShares MSCI Europe SRI UCITS ETF |
IESG LN |
1,217.33 |
218.29 |
196.91 |
|
iShares Global Clean Energy UCITS ETF |
INRG LN |
763.93 |
396.18 |
177.53 |
|
Amundi Index MSCI Europe SRI UCITS ETF DR |
EUSRI FP |
627.22 |
386.47 |
166.84 |
|
iShares MSCI EM ESG Optimized ETF |
ESGE US |
2,029.38 |
1,383.79 |
156.42 |
|
UBS ETF (LU) MSCI World Socially Responsible UCITS ETF (USD) A-dis |
UIMM GY |
1,599.48 |
268.07 |
152.13 |
|
iShares MSCI EAFE ESG Optimized ETF |
ESGD US |
1,583.09 |
280.80 |
135.83 |
|
Xtrackers ESG MSCI World UCITS ETF |
XZW0 LN |
280.72 |
164.21 |
127.68 |
|
iShares Global Clean Energy ETF |
ICLN US |
633.42 |
185.48 |
116.67 |
|
iShares MSCI Japan SRI UCITS ETF |
SUJP LN |
261.87 |
75.79 |
99.80 |
|
Vanguard ESG US Stock ETF |
ESGV US |
994.84 |
207.74 |
98.69 |
|
iShares Euro Corp Bond SRI UCITS ETF |
SUOE LN |
1,124.78 |
69.73 |
96.80 |
|
Xtrackers II ESG EUR Corporate Bond UCITS ETF DR |
XB4F GY |
562.28 |
108.03 |
93.84 |
Confusion persists around what constitutes an ESG fund. According to PRI, a UN-supported initiative which seeks to understand the investment implications of ESG issues, 56% of adopters believe there is a lack of clarity in ESG definitions. ETFGI’s classification system attempts to provide greater precision, with ETFs/ETPs listed globally organised into categories, including core ESG products and theme-based groups, such as Clean/Alternative Energies and Gender Diversity. Please contact deborah.fuhr@etfgi.com if you would like to discuss the cost to subscribe to any of ETFGI’s research or consulting services.


