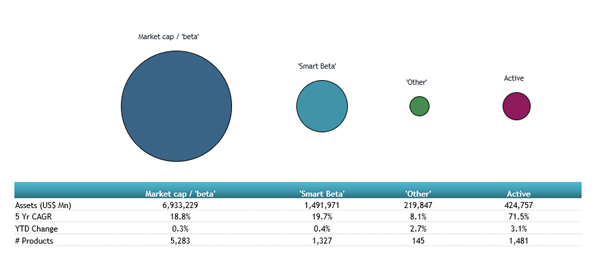
ETFGI, a leading independent research and consultancy firm covering trends in the global ETFs ecosystem, reported today that assets of US$1.56 trillion are invested in Smart Beta ETFs listed globally at the end of February. Smart Beta ETFs listed globally reported net inflows of US$7.81 billion during February, bringing year to date net inflows to US$11.73 billion, which is lower than the US$8.66 billion gathered at this point last year, according to ETFGI’s February 2024 ETF and ETP Smart Beta industry landscape insights report, the monthly report which is part of an annual paid-for research subscription service. (All dollar vales in USD unless otherwise noted.)
Highlights
- Assets of $1.56 Tn invested in Smart Beta ETFs listed globally at the end of February.
- Assets have increased 5.0% YTD in 2024 going from $1.49 Tn at end of 2023 to $1.56 Tn.
- YTD Net inflows of $11.73 Bn in 2024 are the 8th highest on record while YTD Net inflows of $37.36 Bn in 2022 are the highest followed by YTD Net inflows of $19.73 Bn in 2021.
- 9th month of net inflow.
“The S&P 500 index increased by 5.34% in February and is up by 7.11% YTD. Developed markets excluding the US increased by 1.90% in February and are up 1.58% YTD. Ireland (up 8.60%) and Israel (up 8.27%) saw the largest increases amongst the developed markets in February. Emerging markets increased by 4.18% during February and are up 0.57% YTD. China (up 8.41%) and Peru (up 7.12%) saw the largest increases amongst emerging markets in February”, according to Deborah Fuhr, managing partner, founder, and owner of ETFGI.
Comparison of assets in market cap, smart beta, other and active equity products

At the end of February, there were 1,330 smart beta equity ETFs listed globally, with 2,723 listings, assets of $1.56 Tn, from 204 providers listed on 48 exchanges in 38 countries. Following net inflows of $7.81 Bn and market moves during the month, assets invested in Smart Beta ETFs listed globally increased by 4.6%, from $1.49 Tn at the end of January 2024 to $1.56 Tn.
Growth ETFs attracted the greatest monthly net inflows, gathering $3.28 Bn during February. Volatility ETFs suffered the greatest net outflows during the month and amounted to $3.24 Bn.
Substantial inflows can be attributed to the top 20 Smart Beta ETFs by net new assets, which collectively gathered $9.74 Bn during February. Vanguard Growth ETF (VUG US) gathered $1.24 Bn the largest individual net inflow.
Top 20 Smart Beta ETFs/ETPs by net new assets February 2024
|
Name |
|
Ticker |
Assets |
NNA |
NNA |
|
Vanguard Growth ETF |
|
VUG US |
116,116.33 |
1,857.00 |
1,236.08 |
|
Pacer US Small Cap Cash Cows 100 ETF |
|
CALF US |
8,897.62 |
2,103.80 |
988.38 |
|
Vanguard Value ETF |
|
VTV US |
110,924.10 |
180.09 |
583.74 |
|
Invesco S&P 500 Quality ETF |
|
SPHQ US |
8,263.87 |
909.15 |
577.84 |
|
Schwab US Large-Cap Growth ETF |
|
SCHG US |
26,114.94 |
1,049.21 |
536.14 |
|
iShares Edge MSCI USA Quality Factor ETF |
|
QUAL US |
37,950.75 |
(1,324.44) |
532.98 |
|
Invesco S&P MidCap Quality ETF |
|
XMHQ US |
3,965.15 |
914.35 |
478.16 |
|
First Trust SMID Cap Rising Dividend Archievers ETF |
|
SDVY US |
3,411.51 |
924.33 |
477.41 |
|
Vanguard Dividend Appreciation ETF |
|
VIG US |
77,022.05 |
(683.26) |
473.75 |
|
Vanguard Small-Cap Growth ETF |
|
VBK US |
16,825.70 |
508.08 |
468.47 |
|
Invesco S&P 500 Momentum ETF |
|
SPMO US |
719.07 |
375.00 |
365.37 |
|
iShares S&P 500 Value ETF |
|
IVE US |
32,304.39 |
3,875.83 |
354.04 |
|
Cathay Taiwan Select ESG Sustainability High Yield ETF |
|
00878 TT |
8,329.86 |
401.04 |
352.59 |
|
VanEck Vectors Morningstar Wide Moat Research ETF |
|
MOAT US |
13,810.63 |
757.08 |
346.61 |
|
Schwab US Dividend Equity ETF |
|
SCHD US |
53,497.51 |
425.93 |
342.34 |
|
SPDR Portfolio S&P 500 Value ETF |
|
SPYV US |
20,473.50 |
(270.36) |
328.33 |
|
iShares MSCI EAFE Value ETF |
|
EFV US |
17,619.61 |
328.25 |
328.25 |
|
Vanguard Small-Cap Value ETF |
|
VBR US |
27,661.62 |
159.57 |
325.14 |
|
WisdomTree India Earnings |
|
EPI US |
2,675.78 |
547.68 |
321.67 |
|
JPMorgan US Momentum Factor ETF |
|
JMOM US |
755.03 |
340.91 |
320.43 |


