


ETFGI, a leading independent research and consultancy firm covering trends in the global ETF/ETP ecosystem, reported today that ETFs and ETPs listed in the US saw net outflows of US$1.56 billion in January. Assets invested in the US ETF/ETP industry finished the month up 6.95%, from US$3.39 trillion at the end of December, to US$3.63 trillion, according to ETFGI's January 2019 US ETF and ETP industry landscape insights report, an annual paid-for research subscription service. (All dollar values in USD unless otherwise noted.)
Highlights
- Assets invested in the US ETF/ETP industry rise 6.95% in January.
- During January 2019, ETFs/ETPs listed in the US saw $1.56 Bn in net outflows.
- SPY US, arguably the most famous ETF listed, celebrated its 26th anniversary on 22nd Jan.
“In January, equity markets rebounded from the Q4 ’18 downward spiral that few managed to avoid unscathed. Fed chair Powell revised his stance on where he believes the neutral rate of interest lies, easing fears of a dramatic and painful tightening cycle. Energy declines during the Q4 rout subdued inflation in developed economies taking hiking pressure off central banks while provided stimulus to consumers and businesses, giving stronger core metrics. The S&P 500 finished January up 8.01%, the best January since 1987, while the S&P Topix 150 gained 7.26% and the S&P Europe 350 gained 6.23%. Emerging and Frontier markets were up 7.77% and 4.61% respectively, hampered by dollar strength.” according to Deborah Fuhr, managing partner and founder of ETFGI.
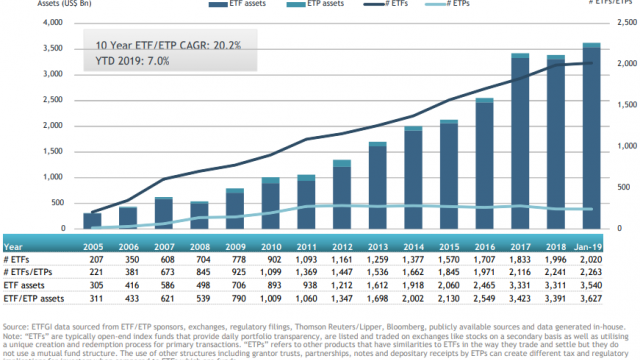
At the end of January 2019, the US ETF/ETP industry had 2,263 ETFs/ETPs, from 148 providers listed on 3 exchanges. Following net outflows of US$1.56 Bn and market moves during the month, assets invested in the US increased by 6.95% from $3.39 Tn at the end of December, to $3.63 Tn.
Growth in US ETF and ETP assets as of the end of January 2019

Equity ETFs/ETPs listed in the US saw net outflows of $18.49 Bn in January, bringing net outflows for 2019 to $18.49 Bn, substantially less than the $64.89 Bn in net inflows equity products had attracted by the end of January 2018. Fixed income ETFs/ETPs listed in the US attracted net inflows of $14.69 Bn in January, bringing net inflows for 2019 to $14.69 Bn, considerably greater than the $8.23 Bn in net inflows fixed income products had attracted by the end of January 2018.
Substantial inflows can be attributed to the top 20 ETF's by net new assets, which collectively gathered $30,893 Bn in January, the iShares Core MSCI Emerging Markets ETF (IEMG US) gathered $4.24 Bn alone.
Top 20 ETFs by net new assets January 2019: US
|
Name |
Ticker |
Assets |
NNA |
NNA |
|
iShares Core MSCI Emerging Markets ETF |
IEMG US |
57,728 |
4,236 |
4,236 |
|
Vanguard Short-Term Corporate Bond ETF |
VCSH US |
23,505 |
3,032 |
3,032 |
|
Vanguard Intermediate-Term Corporate Bond ETF |
VCIT US |
21,300 |
2,647 |
2,647 |
|
iShares MSCI Emerging Markets ETF |
EEM US |
33,348 |
1,882 |
1,882 |
|
iShares Edge MSCI USA Quality Factor ETF |
QUAL US |
9,139 |
1,756 |
1,756 |
|
iShares J.P. Morgan USD Emerging Markets Bond ETF |
EMB US |
16,579 |
1,699 |
1,699 |
|
Vanguard S&P 500 ETF |
VOO US |
99,406 |
1,599 |
1,599 |
|
iShares MBS ETF |
MBB US |
13,919 |
1,497 |
1,497 |
|
SPDR Bloomberg Barclays High Yield Bond ETF |
JNK US |
8,584 |
1,485 |
1,485 |
|
iShares 7-10 Year Treasury Bond ETF |
IEF US |
11,671 |
1,433 |
1,433 |
|
iShares 20+ Year Treasury Bond ETF |
TLT US |
10,130 |
1,294 |
1,294 |
|
Vanguard Total Stock Market ETF |
VTI US |
102,788 |
1,103 |
1,103 |
|
iShares iBoxx $ Investment Grade Corporate Bond ETF |
LQD US |
31,731 |
1,085 |
1,085 |
|
iShares MSCI USA Minimum Volatility ETF |
USMV US |
21,172 |
1,041 |
1,041 |
|
iShares Core S&P Small-Cap ETF |
IJR US |
42,269 |
993 |
993 |
|
iShares US Treasury Bond ETF |
GOVT US |
7,952 |
991 |
991 |
|
Communication Services Select Sector SPDR Fund |
XLC US |
4,089 |
983 |
983 |
|
WisdomTree Floating Rate Treasury Fund |
USFR US |
2,018 |
842 |
842 |
|
Vanguard FTSE Emerging Markets ETF |
VWO US |
60,452 |
662 |
662 |
|
SPDR Bloomberg Barclays Short Term High Yield Bond ETF |
SJNK US |
3,179 |
631 |
631 |

Similarly, the top 10 ETPs by net new assets collectively gathered $3,381 Mn by the end of January 2019, with the SPDR Gold Shares (GLD US) gathering $1.51 Bn.
Top 10 ETPs by net new assets December 2018: US
|
Name |
Ticker |
Assets |
NNA |
NNA |
|
SPDR Gold Shares |
GLD US |
34,069 |
1,514 |
1,514 |
|
iShares Gold Trust |
IAU US |
12,442 |
511 |
511 |
|
iPath Series B S&P 500 VIX Short-Term Futures ETN |
VXXB US |
419 |
280 |
280 |
|
VelocityShares Daily 3x Long Natural Gas ETN |
UGAZ US |
493 |
265 |
265 |
|
ProShares Ultra VIX Short-Term Futures |
UVXY US |
322 |
244 |
244 |
|
Invesco CurrencyShares Japanese Yen Trust |
FXY US |
417 |
240 |
240 |
|
VelocityShares Daily 2x VIX Short Term ETN |
TVIX US |
362 |
109 |
109 |
|
SPDR Gold MiniShares Trust |
GLDM US |
518 |
106 |
106 |
|
VelocityShares 3x Inverse Crude Oil ETN |
DWT US |
90 |
64 |
64 |
|
ProShares VIX Short-Term Futures ETF |
VIXY US |
155 |
50 |
50 |
Investors have tended to invest in emerging market and fixed income ETFs in January.
