


ETFGI, a leading independent research and consultancy firm covering trends in the global ETF/ETP ecosystem, reported today that ETFs and ETPs listed in US gathered net inflows of US$48.62 billion in June, bringing year-to-date net inflows to US$115.86 billion. Assets invested in the US ETF/ETP industry have increased by 6.4%, from US$3.72 trillion at the end of May, to a new high of US$3.96 trillion at the end of June, according to ETFGI's June 2019 US ETF and ETP industry landscape insights report, an annual paid-for research subscription service. (All dollar values in USD unless otherwise noted.)
Highlights
- Assets invested in the US ETF/ETP industry reached $3.96 Trillion.
- Asset invested in the US ETF/ETP industry increased 6.4% in June.
- June 2019, ETFs/ETPs listed in US saw US$48.62 Bn in net inflows.
“Global equities rebounded from prior month losses, with 45 of 49 countries in S&P’s global index posting gains. The S&P 500 gained 7.1% in June (up 4.3% Q2 and up 18.7% H1), bolstered by a dovish Federal Reserve sentiment and optimism surrounding a potential trade deal during the G20 talks contributed to a rebound in U.S. equities with the S&P 500 finishing near all-time high. This trend was followed in the Eurozone and Japanese markets” according to Deborah Fuhr, managing partner and founder of ETFGI.
Growth in US ETF and ETP assets as of the end of June 2019
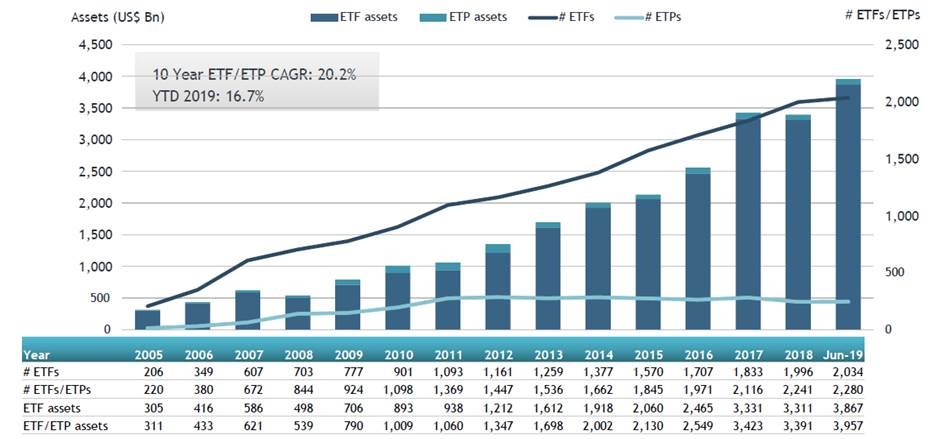
Source: ETFGI data sourced from ETF/ETP sponsors, exchanges, regulatory filings, Thomson Reuters/Lipper, Bloomberg, publicly available sources and data generated in-house.
At the end of June 2019, the US ETF/ETP industry had 2,280 ETFs/ETPs, from 151 providers listed on 3 exchanges.
In June 2019, ETFs/ETPs gathered net inflows of US$48.62 Bn. Fixed income ETFs/ETPs listed in US attracted the largest net inflows of US$23.66 Bn in June, bringing net inflows for 2019 to $65.54 Bn, considerably greater than the US$38.52 Bn in net inflows fixed income products had attracted by the end of June 2018. Equity ETFs/ETPs listed in US attracted net inflows of US$21.15 Bn in June, bringing net inflows for 2019 to US$41.30 Bn, substantially less than the US$71.02 Bn in net inflows equity products had attracted by the end of June 2018. Commodity ETFs/ETPs gathered US$2.16 (I see 2.95) Bn bringing net inflows to US$2.95(I see 152 Mn) Bn for 2019 which is significantly/slightly greater than the US$152 (I see 112) Mn in net inflows gathered through June 2018.
Substantial inflows can be attributed to the top 20 ETF's by net new assets, which collectively gathered US$34.29 Bn in June, the iShares iBoxx $ Investment Grade Corporate Bond ETF (LQD US) gathered US$4.54 Bn alone.
Top 20 ETFs by net new assets June 2019: US
|
Name |
Ticker |
Assets |
NNA |
NNA |
|
iShares iBoxx $ Investment Grade Corporate Bond ETF |
LQD US |
36999.68 |
4157.28 |
4539.55 |
|
iShares Short Treasury Bond ETF |
SHV US |
24595.27 |
3832.42 |
4064.91 |
|
SPDR S&P 500 ETF Trust |
SPY US |
268585.32 |
(11914.46) |
3761.21 |
|
iShares iBoxx $ High Yield Corporate Bond ETF |
HYG US |
17598.68 |
3379.83 |
2967.84 |
|
Vanguard S&P 500 ETF |
VOO US |
115721.67 |
9290.93 |
2487.70 |
|
iShares 7-10 Year Treasury Bond ETF |
IEF US |
16873.73 |
5937.51 |
2262.45 |
|
Invesco QQQ Trust |
QQQ US |
74329.41 |
462.36 |
1766.74 |
|
iShares Core U.S. Aggregate Bond ETF |
AGG US |
64060.39 |
4145.55 |
1227.12 |
|
iShares Core MSCI EAFE ETF |
IEFA US |
65775.57 |
7237.59 |
1181.62 |
|
iShares Short-Term Corporate Bond ETF |
IGSB US |
12439.53 |
1807.44 |
1091.18 |
|
SPDR Bloomberg Barclays Intermediate Term Treasury ETF |
ITE US |
1706.19 |
1068.51 |
964.32 |
|
Vanguard Mortgage-Backed Securities ETF |
VMBS US |
9831.89 |
2060.23 |
960.09 |
|
Vanguard Total Bond Market ETF |
BND US |
41516.80 |
3280.85 |
948.34 |
|
Consumer Staples Select Sector SPDR Fund |
XLP US |
11935.86 |
962.27 |
926.35 |
|
iShares MSCI USA Minimum Volatility ETF |
USMV US |
28604.14 |
5807.16 |
911.56 |
|
SPDR Bloomberg Barclays High Yield Bond ETF |
JNK US |
9402.31 |
2060.97 |
886.67 |
|
iShares US Treasury Bond ETF |
GOVT US |
11764.20 |
4430.53 |
863.12 |
|
iShares J.P. Morgan USD Emerging Markets Bond ETF |
EMB US |
15704.39 |
146.12 |
846.53 |
|
SPDR Bloomberg Barclays 1-3 Month T-Bill ETF |
BIL US |
9306.44 |
621.79 |
831.78 |
|
iShares Core MSCI Total International Stock ETF |
IXUS US |
15217.75 |
1777.06 |
805.13 |

The top 10 ETP's by net new assets collectively gathered $3.58 Bn in June. The SPDR Gold Shares (GLD US) gathered $2.24 Bn alone.
Top 10 ETPs by net new assets June 2019:US
|
Name |
Ticker |
Assets |
NNA |
NNA |
|
SPDR Gold Shares |
GLD US |
34945.36 |
422.89 |
2240.94 |
|
iShares Gold Trust |
IAU US |
13346.62 |
659.88 |
537.28 |
|
VelocityShares Daily 3x Long Natural Gas ETN |
UGAZ US |
580.22 |
627.09 |
200.87 |
|
iShares Silver Trust |
SLV US |
4919.27 |
99.77 |
171.27 |
|
iPath Series B S&P 500 VIX Short-Term Futures ETN |
VXX US |
779.60 |
810.98 |
154.49 |
|
United States Natural Gas Fund LP |
UNG US |
324.94 |
75.82 |
89.64 |
|
Large Cap Growth Index-Linked Exchange Traded Notes due 2028 |
FRLG US |
935.13 |
356.25 |
56.91 |
|
FI Enhanced Global High Yield ETN |
FIHD US |
2032.27 |
242.16 |
47.42 |
|
ProShares Ultra VIX Short-Term Futures |
UVXY US |
512.61 |
639.65 |
41.80 |
|
VelocityShares Daily 2x VIX Short Term ETN |
TVIX US |
755.97 |
938.77 |
40.97 |

Source: ETFGI data sourced from ETF/ETP sponsors, exchanges, regulatory filings, Thomson Reuters/Lipper, Bloomberg, publicly available sources and data generated in-house.
Investors have tended to invest in Fixed Income and equity ETFs in June.


