


ETFGI, a leading independent research and consultancy firm covering trends in the global ETF/ETP ecosystem, reported today that assets invested in the US ETFs and ETPs industry broke through the US$4 trillion milestone at the end of July. ETFs and ETPs listed in US gathered net inflows of US$33.90 billion in July, bringing year-to-date net inflows to US$149.76 billion. Assets invested in the US ETF/ETP industry have increased by 1.6%, from US$3.96 trillion at the end of June, to a new record of US$4.02 trillion, according to ETFGI's July 2019 US ETF and ETP industry landscape insights report, an annual paid-for research subscription service. (All dollar values in USD unless otherwise noted.)
Highlights
- Assets invested in the US ETFs/ETPs industry reached break through the $4 Trillion milestone.
- Asset invested in the US ETFs/ETPs industry increased 1.6% in July.
- July 2019, ETFs/ETPs listed in US gathered $33.90 Bn in net inflows.
“The S&P 500® gained 1.4% in July, as strong earnings combined with signs of economic growth and expectations of a rate cut by the Federal Reserve supported equity gains. International markets posted losses, with the S&P Developed Ex-U.S. and the S&P Emerging BMI both down 1%, with headwinds including U.S. dollar strength. Boris Johnson began his term as U.K. Prime Minister with demands for a renegotiation of the E.U. withdrawal agreement, issuing a threat to otherwise leave without one. Pound sterling fell to near its lowest in two years. according to Deborah Fuhr, managing partner, founder and owner of ETFGI.
Growth in US ETF and ETP assets as of the end of July 2019
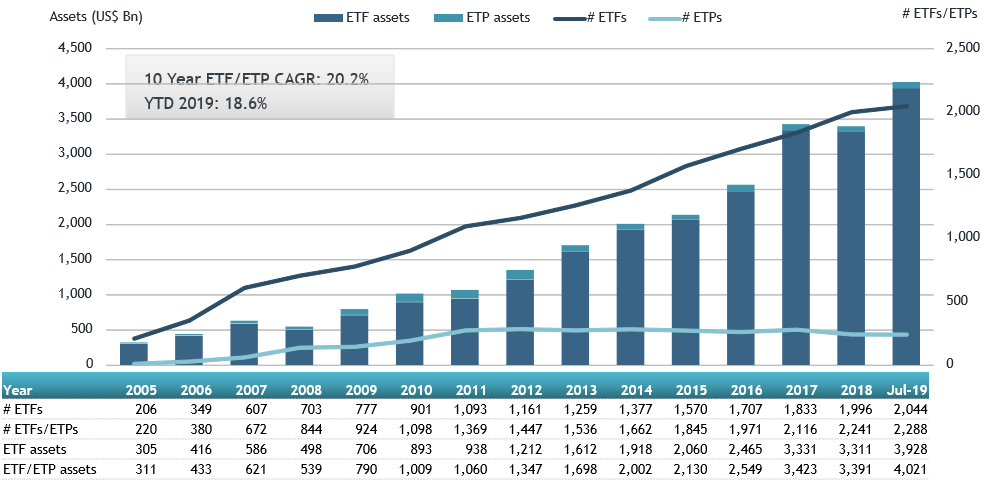

At the end of July 2019, the US ETF/ETP industry had 2,280 ETFs/ETPs, from 151 providers listed on 3 exchanges.
In July 2019, ETFs/ETPs gathered net inflows of $33.90 Bn. Equity ETFs/ETPs listed in US attracted the largest net inflows of $23.62 Bn in July, bringing net inflows for 2019 to $64.92 Bn, considerably less than the $89.77 Bn in net inflows equity products had attracted by the end of July 2018. Fixed Income ETFs/ETPs listed in US attracted net inflows of $7.56 Bn in July, bringing net inflows for 2019 to $73.10 Bn, substantially more than the $46.61 Bn in net inflows Fixed Income products had attracted by the end of July 2018. Commodity ETFs/ETPs gathered $2.34 Bn bringing net inflows to $2.49 Bn for 2019 which is significantly greater than the $968 Mn in net outflows gathered through July 2018.
Substantial inflows can be attributed to the top 20 ETF's by net new assets, which collectively gathered $26.23 Bn in July, the SPDR S&P 500 ETF Trust (SPY US) gathered $4.08 Bn alone.
Top 20 ETFs by net new assets July 2019: US
|
Name |
Ticker |
Assets |
NNA |
NNA |
|
SPDR S&P 500 ETF Trust |
SPY US |
280545.29 |
(7,835.94) |
4078.52 |
|
iShares Core S&P 500 ETF |
IVV US |
180229.16 |
4,877.21 |
3383.59 |
|
Vanguard S&P 500 ETF |
VOO US |
118712.26 |
11,733.64 |
2442.70 |
|
iShares MSCI USA Minimum Volatility ETF |
USMV US |
30647.10 |
7,390.56 |
1583.39 |
|
Vanguard Total Stock Market ETF |
VTI US |
118172.13 |
6,257.92 |
1462.96 |
|
iShares Russell 2000 ETF |
IWM US |
43454.22 |
(2,942.89) |
1389.74 |
|
iShares MBS ETF |
MBB US |
18303.33 |
5,522.32 |
1364.80 |
|
SPDR Gold Shares |
GLD US |
37780.35 |
1,775.03 |
1352.13 |
|
SPDR S&P Dividend ETF |
SDY US |
20122.73 |
1,493.49 |
1273.37 |
|
iShares iBoxx $ High Yield Corporate Bond ETF |
HYG US |
18659.23 |
4,417.65 |
1037.82 |
|
Goldman Sachs ActiveBeta U.S. Large Cap Equity ETF |
GSLC US |
6209.20 |
1,795.26 |
1031.49 |
|
Vanguard Total Bond Market ETF |
BND US |
42416.83 |
4,149.92 |
869.07 |
|
Vanguard Total International Stock Index Fund ETF |
VXUS US |
13749.46 |
2,709.75 |
838.26 |
|
Vanguard Total International Bond ETF |
BNDX US |
19197.47 |
4,959.22 |
668.09 |
|
Utilities Select Sector SPDR Fund |
XLU US |
10741.64 |
1,257.91 |
632.03 |
|
Vanguard Mid-Cap ETF |
VO US |
27035.06 |
989.77 |
613.97 |
|
iShares Gold Trust |
IAU US |
14125.64 |
1,265.26 |
605.38 |
|
Vanguard FTSE Developed Markets ETF |
VEA US |
71541.62 |
166.92 |
562.33 |
|
iShares Silver Trust |
SLV US |
5874.60 |
629.74 |
529.97 |
|
iShares Russell 1000 ETF |
IWB US |
21078.97 |
(222.66) |
514.07 |
The top 10 ETP's by net new assets collectively gathered $3.50 Bn in July. The SPDR Gold Shares (GLD US) gathered $1.35 Bn alone.
Top 10 ETPs by net new assets July 2019:US
|
Name |
Ticker |
Assets |
NNA |
NNA |
|
SPDR Gold Shares |
GLD US |
37780.35 |
1775.03 |
1352.13 |
|
iShares Gold Trust |
IAU US |
14125.64 |
1265.26 |
605.38 |
|
iShares Silver Trust |
SLV US |
5874.60 |
629.74 |
529.97 |
|
VelocityShares Daily 2x VIX Short Term ETN |
TVIX US |
1005.89 |
1316.82 |
378.05 |
|
iPath Series B S&P 500 VIX Short-Term Futures ETN |
VXX US |
985.90 |
1057.74 |
246.76 |
|
ProShares Ultra VIX Short-Term Futures |
UVXY US |
567.24 |
734.78 |
95.13 |
|
VelocityShares Daily 3x Long Natural Gas ETN |
UGAZ US |
641.44 |
717.45 |
90.36 |
|
SPDR Gold MiniShares Trust |
GLDM US |
880.50 |
408.65 |
77.71 |
|
ProShares VIX Short-Term Futures ETF |
VIXY US |
293.83 |
256.09 |
66.25 |
|
Large Cap Growth Index-Linked Exchange Traded Notes due 2028 |
FRLG US |
1038.13 |
417.55 |
61.30 |
Investors have tended to invest in Equity/Fixed Income ETFs in July.

