


ETFGI, a leading independent research and consultancy firm covering trends in the global ETF/ETP ecosystem, reported today that ETFs and ETPs listed Globally gathered net inflows of US$37.48 billion in March, bringing year-to-date net inflows to US$99.14 billion. Assets invested in the Global ETF/ETP industry finished the month up 1.42%, from US$5.32 trillion at the end of February, to US$5.40 trillion, according to ETFGI's March 2019 Global ETF and ETP industry landscape insights report, an annual paid-for research subscription service. (All dollar values in USD unless otherwise noted.)
Highlights
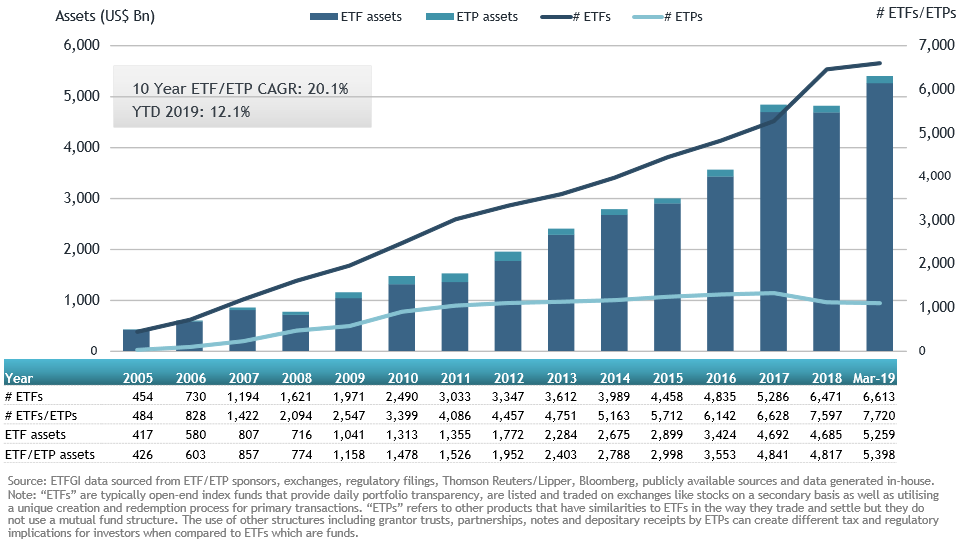
- Assets invested in the Global ETF/ETP industry reach a new record US$5.40 Tn.
- April 11th marks the 19th anniversary of the listing of the first ETF in Europe.
- Assets invested in the Global ETF/ETP industry rise 1.41% in March.
- During March 2019, ETFs/ETPs listed Globally attracted $37.21 Bn in net inflows.
- 62 consecutive months of net inflows into ETFs/ETPs listed globally.
“Markets appear to have returned to the relative calm they had grown accustomed to over the past few years. Returns for developed indices decelerated in March, as the effects of more cautious and accommodative central bank policies lose steam. The S&P 500 finished March up 1.94%, with year-to-date returns of 13.65%, marking its best quarter since ‘09. The S&P Europe 350 rose 0.92% in March, as economic data from the region continues to send mixed signals, bringing year-to-date returns to 10.90%. The Topix 150 in Japan was up 0.32% in March, bringing year-to-date returns of 7.96%. Emerging & Frontier returns continued to outpace developed markets. The S&P Emerging BMI and Frontier BMI finished March up 1.74% and 1.37%, bringing year to date returns to 10.45% and 8.82%, respectively.” according to Deborah Fuhr, managing partner and founder of ETFGI.
April 11th marks the 19th anniversary of the listing of the first ETFs in Europe. European Exchange Traded Fund Company launched two listed diversified return securities (LDRS) on the Deutsche Borse. These funds are co-managed by Merrill Lynch and track the Dow Jones Euro Stoxx 50 and Stoxx 50 indexes.
At the end of March 2019, the Global ETF/ETP industry had 7,720 ETFs/ETPs, from 412 providers listed on 72 exchanges in 58 countries. Following net inflows of $37.21 Bn and market moves during the month, assets invested in the Global ETF/ETP industry increased by 1.41% from $5.32 Tn at the end of February, to $5.40 Tn.
Growth in Global ETF and ETP assets as of the end of March 2019
Equity ETFs/ETPs listed Globally attracted net inflows of $16.51 Bn in March, bringing net inflows for 2019 to $36.30 Bn, substantially less than the $100.52 Bn Mn in net inflows equity products had attracted by the end of March 2018. Fixed income ETFs/ETPs listed Globally attracted net inflows of $17.98 Bn in March, bringing net inflows for 2019 to $56.36 Bn, considerably greater than the $17.48 Bn in net inflows fixed income products had attracted by the end of March 2018.
Substantial inflows can be attributed to the top 20 ETF's by net new assets, which collectively gathered $30.49 Bn in March, the iShares Core S&P 500 ETF (IVV US) gathered $7.19 Bn alone.
Top 20 ETFs by net new assets March 2019: Global
|
Name |
Ticker |
Assets |
NNA |
NNA |
|
iShares Core S&P 500 ETF |
IVV US |
167,280 |
582 |
7,189 |
|
Vanguard S&P 500 ETF |
VOO US |
107,671 |
5,244 |
3,434 |
|
iShares Core MSCI EAFE ETF |
IEFA US |
60,232 |
2,628 |
2,672 |
|
ICBC Credit Suisse SSE 50 ETF |
510850 CH |
1,978 |
1,981 |
1,981 |
|
SPDR Bloomberg Barclays High Yield Bond ETF |
JNK US |
9,757 |
2,503 |
1,475 |
|
iShares Core € Corp Bond UCITS ETF |
IEBC LN |
10,538 |
2,026 |
1,263 |
|
iShares 1-3 Year Treasury Bond ETF |
SHY US |
20,532 |
(508) |
1,172 |
|
iShares iBoxx $ High Yield Corporate Bond ETF |
HYG US |
16,460 |
2,393 |
1,052 |
|
SPDR S&P 500 ETF Trust |
SPY US |
266,531 |
(4,142) |
1,014 |
|
Vanguard Total Stock Market ETF |
VTI US |
108,774 |
2,531 |
951 |
|
Vanguard Short-Term Bond ETF |
BSV US |
23,765 |
(4,470) |
945 |
|
iShares MSCI USA Minimum Volatility ETF |
USMV US |
24,990 |
3,493 |
942 |
|
Nikkei 225 Exchange Traded Fund |
1321 JP |
53,529 |
707 |
878 |
|
iShares Core MSCI World UCITS ETF |
IWDA LN |
16,553 |
921 |
865 |
|
Xtrackers MSCI USA ESG Leaders Equity ETF |
USSG US |
872 |
842 |
842 |
|
Communication Services Select Sector SPDR Fund |
XLC US |
5,287 |
2,122 |
827 |
|
iShares J.P. Morgan EM Local Govt Bond UCITS ETF |
SEML LN |
9,017 |
2,284 |
787 |
|
Ping An China Bond - Medium-High Grade Corporate Bond Spread factors ETF Fund |
511030 CH |
767 |
765 |
765 |
|
JPMorgan Ultra-Short Income ETF |
JPST US |
6,430 |
1,284 |
722 |
|
iShares National Muni Bond ETF |
MUB US |
12,280 |
149 |
716 |

The top 10 ETP's by net new assets collectively gathered $957.49 Mn in March. the VelocityShares Daily 2x VIX Short Term ETN (TVIX US) gathered $333.76 Mn.
Top 10 ETPs by net new assets March 2019: Global
|
Name |
Ticker |
Assets |
NNA |
NNA |
|
VelocityShares Daily 2x VIX Short Term ETN |
TVIX US |
855 |
807 |
334 |
|
ProShares Ultra VIX Short-Term Futures |
UVXY US |
547 |
580 |
116 |
|
iPath Series B S&P 500 VIX Short-Term Futures ETN |
VXXB US |
751 |
709 |
114 |
|
iShares Gold Trust |
IAU US |
12,556 |
897 |
87 |
|
Xtrackers Physical Gold GBP Hedged ETC |
XGLS LN |
131 |
69 |
64 |
|
ETFS WTI Crude Oil |
CRUD LN |
683 |
50 |
62 |
|
Large Cap Growth Index-Linked Exchange Traded Notes due 2028 |
FRLG US |
706 |
186 |
53 |
|
ProShares VIX Short-Term Futures ETF |
VIXY US |
203 |
129 |
46 |
|
VelocityShares Daily 3x Inverse Natural Gas ETN |
DGAZ US |
276 |
(135) |
45 |
|
Xetra Gold EUR |
4GLD GY |
8,015 |
453 |
37 |
Investors have tended to invest in large cap equity/fixed income ETFs in March.

