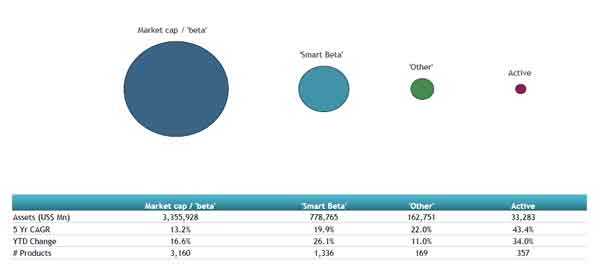
ETFGI, a leading independent research and consultancy firm covering trends in the global ETFs/ETPs ecosystem, reported today that equity-based Smart Beta ETFs and ETPs listed globally gathered net inflows of US$5.73 billion during September. Year-to-date through to the end of September 2019, Smart Beta Equity ETFs/ETPs assets have increased by 26.1% from US$618 billion to US$779 billion, with a 5-year CAGR of 19.9%, according to ETFGI’s September 2019 Smart Beta ETFs and ETPs industry landscape insights report, an annual paid-for research subscription service. (All dollar values in USD unless otherwise noted.)
Highlights
- Assets invested in Smart Beta Equity ETFs/ETPs reached a record of $779 billion.
- In September 2019, Equity Smart Beta ETFs/ETPs attracted $5.73 billion in net inflows.
- 44th consecutive month of net inflows into Smart Beta Equity ETFs/ETPs.
At the end of September 2019, there were 1,336 smart beta equity ETFs/ETPs, with 2,506 listings, assets of $779 billion, from 169 providers on 41 exchanges in 33 countries. Following net inflows of $5.73 billion and market moves during the month, assets invested in Smart Beta ETFs/ETPs listed globally increased by 1.26%, from $759 billion at the end of August 2019 to $779 billion.
Comparison of assets in market cap, smart beta, other and active equity products


Value ETFs and ETPs attracted the greatest monthly net inflows, gathering $2.31 billion in September. Growth ETFs and ETPs suffered the greatest outflows during the month and amounted to $542 million.
Substantial inflows can be attributed to the top 20 Smart Beta ETFs/ETPs by net new assets, which collectively gathered $8.48 billion in September, the iShares MSCI USA Minimum Volatility ETF (USMV US) gathered $1.62 billion alone.
Top 20 Smart Beta ETFs/ETPs by net new assets September 2019
|
Name |
Ticker |
Assets |
NNA |
NNA |
|
iShares MSCI USA Minimum Volatility ETF |
USMV US |
35,135.99 |
11,191.79 |
1,615.68 |
|
First Trust Financial AlphaDEX Fund |
FXO US |
1,796.14 |
769.17 |
864.82 |
|
Vanguard Dividend Appreciation ETF |
VIG US |
38,544.01 |
2,933.49 |
831.56 |
|
SPDR Portfolio S&P 500 Value ETF |
SPYV US |
3,674.32 |
1,031.29 |
522.39 |
|
First Trust Value Line Dividend Index Fund |
FVD US |
7,865.23 |
2,492.93 |
467.03 |
|
Vanguard Value ETF |
VTV US |
49,883.19 |
2,509.70 |
453.19 |
|
iShares Edge MSCI Minimum Volatility EAFE ETF |
EFAV US |
11,982.73 |
1,418.49 |
427.69 |
|
Schwab US Large-Cap Value ETF |
SCHV US |
6,545.80 |
1,102.74 |
411.96 |
|
UBS Irl ETF plc - MSCI USA Select Factor Mix UCITS ETF |
USFMA SW |
484.18 |
479.17 |
346.44 |
|
iShares Edge MSCI USA Quality Factor ETF |
QUAL US |
11,725.10 |
3,313.04 |
336.72 |
|
iShares Core Dividend Growth ETF |
DGRO US |
8,643.82 |
2,533.16 |
328.66 |
|
iShares S&P Small-Cap 600 Value ETF |
IJS US |
6,373.57 |
220.72 |
272.87 |
|
Schwab US Dividend Equity ETF |
SCHD US |
10,286.31 |
1,330.43 |
250.28 |
|
iShares Edge MSCI USA Value Factor ETF |
VLUE US |
3,540.46 |
(313.56) |
217.40 |
|
Invesco S&P 500 Low Volatility ETF |
SPLV US |
12,815.87 |
2,626.30 |
216.49 |
|
Vanguard Small-Cap Value ETF |
VBR US |
13,390.61 |
473.19 |
198.87 |
|
Invesco DWA Momentum ETF |
PDP US |
1,705.89 |
(69.38) |
196.59 |
|
John Hancock Multi-Factor Mid Cap ETF |
JHMM US |
1,376.72 |
518.94 |
184.23 |
|
Xtrackers Equity Low Beta Factor UCITS ETF (DR) - 1C |
XDEB GY |
744.84 |
565.71 |
183.07 |
|
First Trust Capital Strength ETF |
FTCS US |
2,862.53 |
1,189.39 |
151.31 |


