


ETFGI, a leading independent research and consultancy firm covering trends in the global ETF/ETP ecosystem, reported today that ETFs and ETPs listed in the Middle East and Africa saw net outflows of US$249.36 million in January. Assets invested in the Middle East and African ETF/ETP industry finished the month up 7.91%, from US$29.14 billion at the end of December, to US$31.44 billion, according to ETFGI's January 2019 Middle East and Africa ETF and ETP industry landscape insights report, an annual paid-for research subscription service. (All dollar values in USD unless otherwise noted.)
Highlights
- Assets invested in the Middle East and African ETF/ETP industry rise 7.91% in January.
- During January 2019, ETFs/ETPs listed in the Middle East and Africa saw US$249.36 Mn in net outflows.
- Products providing exposure to commodities attracted the greatest net new assets during the month.
“In January, equity markets rebounded from Q4 when global equities suffered steep declines amid persistent worries over trade and economic growth. Fed chair Powell revised his stance on where he believes the neutral rate of interest lies, easing fears of a dramatic and painful tightening cycle. Energy’s decline during the Q4 rout subdued inflation in developed economies taking hiking pressure off central banks while provided stimulus to consumers and businesses, giving stronger core metrics. The S&P 500 finished January up 8.01%, the best January since 1987, while the S&P Topix 150 gained 7.26% and the S&P Europe 350 gained 6.23%. Emerging and Frontier markets were up 7.77% and 4.61% respectively, hampered by dollar strength.” according to Deborah Fuhr, managing partner and founder of ETFGI.
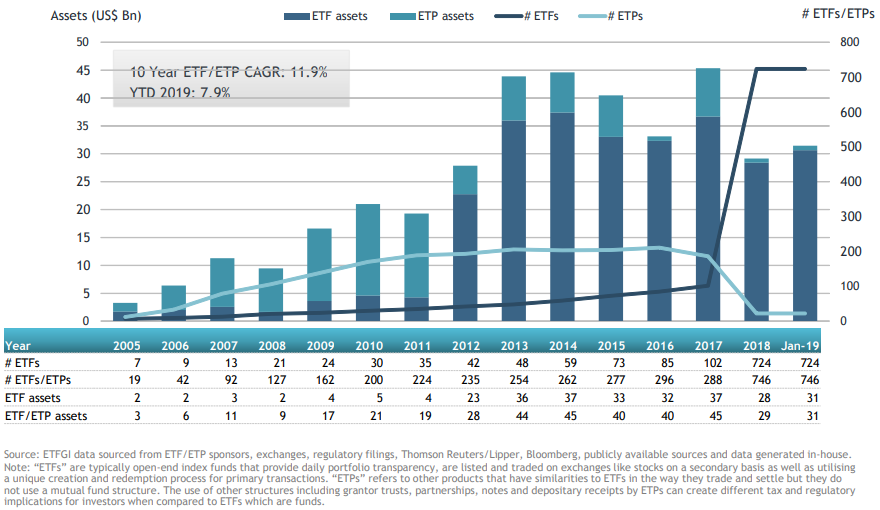
By the end of January 2019, the Middle East and African ETF/ETP industry had 746 ETFs/ETPs, from 45 providers listed on 14 exchanges. Following net outflows of $249.36 Mn and market moves during the month, assets invested in the Middle East and African ETF/ETP industry increased by 7.91% from $29.14 Bn at the end of December, to $31.44 Bn.
Growth in the Middle East and African ETF and ETP assets as of the end of January 2019
Equity ETFs/ETPs listed in the Middle East and Africa saw net outflows of $242.28 Mn in January, less than the $279.31 Mn in net outflows equity products had experienced by the end of January 2018. Fixed income ETFs/ETPs listed in the Middle East and Africa saw net outflows of $65.51 Mn in January, less than the $17.44 Mn in net inflows fixed income products had attracted by the end of January 2018.
Substantial inflows can be attributed to the top 10 ETFs/ET’s by net new assets, which collectively gathered $203.39 Mn in January, the NewPlat ETF (NGPLT SJ) gathered $45.92 Mn alone.
Top 10 ETFs by net new assets January 2019: Middle East and Africa
|
Name |
Ticker |
Assets |
NNA |
NNA |
|
NewPlat ETF |
NGPLT SJ |
610 |
46 |
46 |
|
NewPalladium ETF |
NGPLD SJ |
132 |
39 |
39 |
|
Tachlit Sal S&P 500 |
TCHF76 IT |
470 |
27 |
27 |
|
Harel Sal Tel-Bond Shekel |
HRLF24 IT |
140 |
16 |
16 |
|
Psagot ETF (00) Tel Bond Shekel-50 |
PSGF28 IT |
57 |
14 |
14 |
|
Tachlit Sal NASDAQ 100 |
TCHF77 IT |
234 |
14 |
14 |
|
Psagot ETF (00) Tel Bond-Global |
PSGF32 IT |
26 |
13 |
13 |
|
Sygnia Itrix MSCI World |
SYGWD SJ |
552 |
12 |
12 |
|
Harel Sal Tel-Bond Shekel Banks-Insurance |
HRLF303 IT |
46 |
12 |
12 |
|
Psagot ETF (4A) TA-Banks5 |
PSGF35 IT |
363 |
11 |
11 |

Investors have tended to invest in core, market cap ETFs in January.

