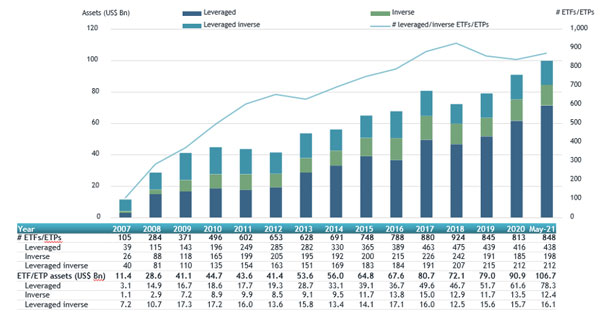
ETFGI, a leading independent research and consultancy firm covering trends in the global ETFs and ETPs ecosystem, reports assets invested in Leveraged and Inverse ETFs and ETPs listed globally reached a record US$106.7 billion US Dollars the end of May. Leveraged and Inverse ETFs and ETPs suffered net outflows of US$4.14 billion during May bringing year to date net outflows to US$199 million. Total assets invested in leveraged and inverse ETFs and ETPs increased from US$102.4 billion at the end of April to US$106.7 billion, according to ETFGI’s May 2021 Leveraged and Inverse ETF and ETP industry landscape insights report, the monthly report which is part of an annual paid-for research subscription service. (All dollar values in USD unless otherwise noted.)
Highlights
- Record $106.7 billion invested in Leveraged and Inverse ETFs and ETPs listed globally at end of May.
- Leveraged and inverse ETFs and ETPs listed globally suffered net outflows of $4.14 Bn during May.
- Year to date leveraged and inverse ETFs and ETPs listed globally have suffered net outflows of $199 Mn.
The S&P 500 gained 0.7% in May and 12.62% YTD, with positive figures for four consecutive months. Developed markets ex-U.S. gained 3.11% in May. Austria 8.29% and Luxembourg 8.12% were the leaders of the month while New Zealand lost 3.92%. Emerging markets were up 2.58% at the end of May. Hungary (up 15.54%) and Poland (up 13.98%) were the leaders, whilst Egypt (down 3.86%), Chile (down 3.64%), and Malaysia (down 2.79%) were down the most.” According to Deborah Fuhr, managing partner, founder and owner of ETFGI.
Global leveraged/inverse ETF and ETP asset growth at the of end of May 2021

The Global leveraged and inverse ETFs and ETPs industry had 864 products at the end of May. The majority of assets - $78.21 Bn - were invested in Leveraged ETFs and ETPs, followed by $16.05 Bn invested in Leveraged Inverse products and $12.38 Bn invested in Inverse products. The largest market for leveraged and inverse ETFs and ETPs was in the United States, which, at the end of May 2021, had assets of $71.0 Bn invested in 210 ETFs/ETPs.
The top 20 leveraged and inverse ETFs and ETPs by Year-to-Date net new assets collectively gathered $9.86 Bn year-to-date to May 2021. The Direxion Daily Semiconductors Bull 3x Shares (SOXL US) gathered $2.01 Bn alone, the largest net inflow year-to-date to May.
Top 20 ETFs/ETPs by YTD net new assets May 2021: Leveraged and Inverse
|
Name |
Country Listed |
Ticker |
Assets |
NNA |
Leverage |
|
Direxion Daily Semiconductors Bull 3x Shares |
US |
SOXL US |
4,872.28 |
2,010.98 |
Leveraged |
|
ProShares Ultra VIX Short-Term Futures |
US |
UVXY US |
820.95 |
981.16 |
Leveraged |
|
iPath Series B S&P 500 VIX Short-Term Futures ETN |
US |
VXX US |
1,089.78 |
903.84 |
Leveraged |
|
ProShares UltraPro Short QQQ |
US |
SQQQ US |
1,733.56 |
778.39 |
Leveraged Inverse |
|
ProShares UltraShort 20+ Year Treasury |
US |
TBT US |
1,415.22 |
762.16 |
Leveraged Inverse |
|
MicroSectors FANG+ Index 3X Leveraged ETNs due January 8, 2038 |
US |
FNGU US |
1,518.54 |
708.07 |
Leveraged |
|
Direxion Daily S&P Biotech Bull 3X Shares |
US |
LABU US |
747.64 |
677.64 |
Leveraged |
|
KB KBSTAR KTB 3Y Futures Inverse ETF - Acc |
South Korea |
282000 KS |
588.87 |
530.80 |
Inverse |
|
Samsung KODEX 200 Futures Inverse 2X ETF - Acc |
South Korea |
252670 KS |
1,849.77 |
419.24 |
Leveraged Inverse |
|
ProShares Short 20+ Year Treasury |
US |
TBF US |
592.32 |
289.19 |
Inverse |
|
Yuanta/P-shares CSI 300 2X Bull ETF - Acc |
Taiwan |
00637L TT |
891.88 |
265.39 |
Leveraged |
|
Samsung KODEX Inverse ETF |
South Korea |
114800 KS |
992.10 |
238.91 |
Inverse |
|
ProShares UltraPro QQQ |
US |
TQQQ US |
12,149.67 |
206.21 |
Leveraged |
|
Lyxor UCITS ETF DAILY DOUBLE SHORT BUND - Acc |
France |
DSB FP |
464.68 |
204.79 |
Leveraged Inverse |
|
CSOP Hang Seng TECH Index Daily 2X Leveraged Product |
Hong Kong |
7226 HK |
186.80 |
195.41 |
Leveraged |
|
Cathay US Treasury 20+ YR Inv 1X ETF - Acc |
Taiwan |
00689R TT |
170.37 |
144.53 |
Inverse |
|
Direxion Daily Small Cap Bear 3x Shares |
US |
TZA US |
340.71 |
143.75 |
Leveraged Inverse |
|
Lyxor UCITS ETF CAC 40 DAILY DOUBLE SHORT - Acc |
France |
BX4 FP |
306.87 |
140.39 |
Leveraged Inverse |
|
ProShares Short QQQ |
US |
PSQ US |
595.58 |
134.64 |
Inverse |
|
Direxion Daily FTSE China Bull 3x Shares |
US |
YINN US |
390.65 |
122.90 |
Leveraged |


